IN3OTD's web site
...under perpetual construction.

HF PA with a push-pull of RD15HVF1
Measurements on a QRP power amplifier using a push-pull of Mitsubishi RD15HVF1.
This PA was a prototype for the Hermes-Lite PA; for measurements of this PA performance with the Hermes-Lite see this page.
The PA was built on a versatile "PA test board" designed by Steve Haynal, KF7O:

The two LDMOS are held against a big heatsink using a large adjustable clamp.
Measurements were done
The input transformer was wound on a BN43-2402 binocular core (5 turns on the 50 Ω input side and 5+5 turns to the MOS gates, center tap connected to ground)
The output transformer was different from the one used for the characterization with the Hermes-Lite frontend; here a BN43-202 binocular core with 1+1 turns on the MOS side and 4 turns on the 50 Ω side was used.
The drain bias current was 100 mA per device.
The schematic is quite simple, a classic push-pull amplifier with resistive feedback:

PA output at Vdd=12 V
The PA was powered using a 12 V regulated supply.
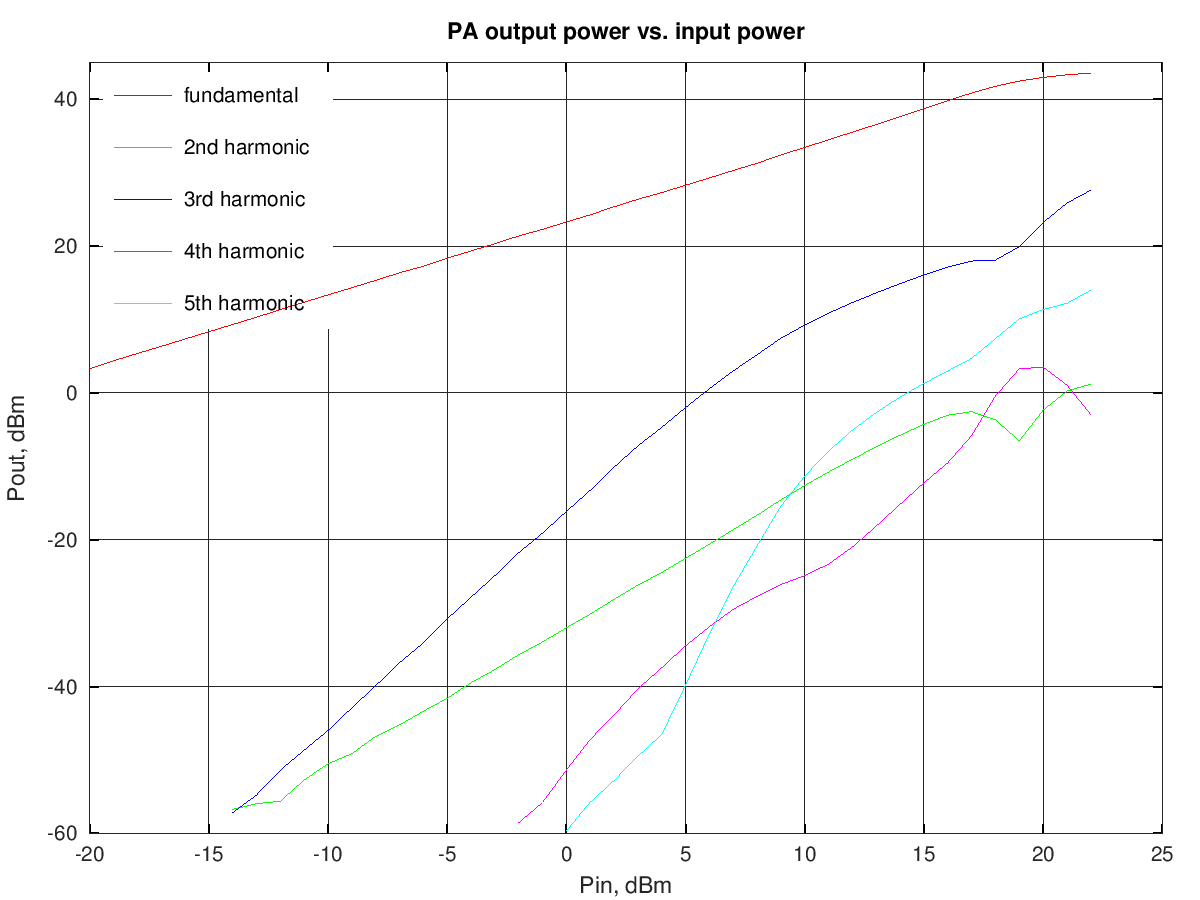
The fundamental and harmonics output levels versus input power, with a 10 MHz sinewave input, are shown in the graph below:
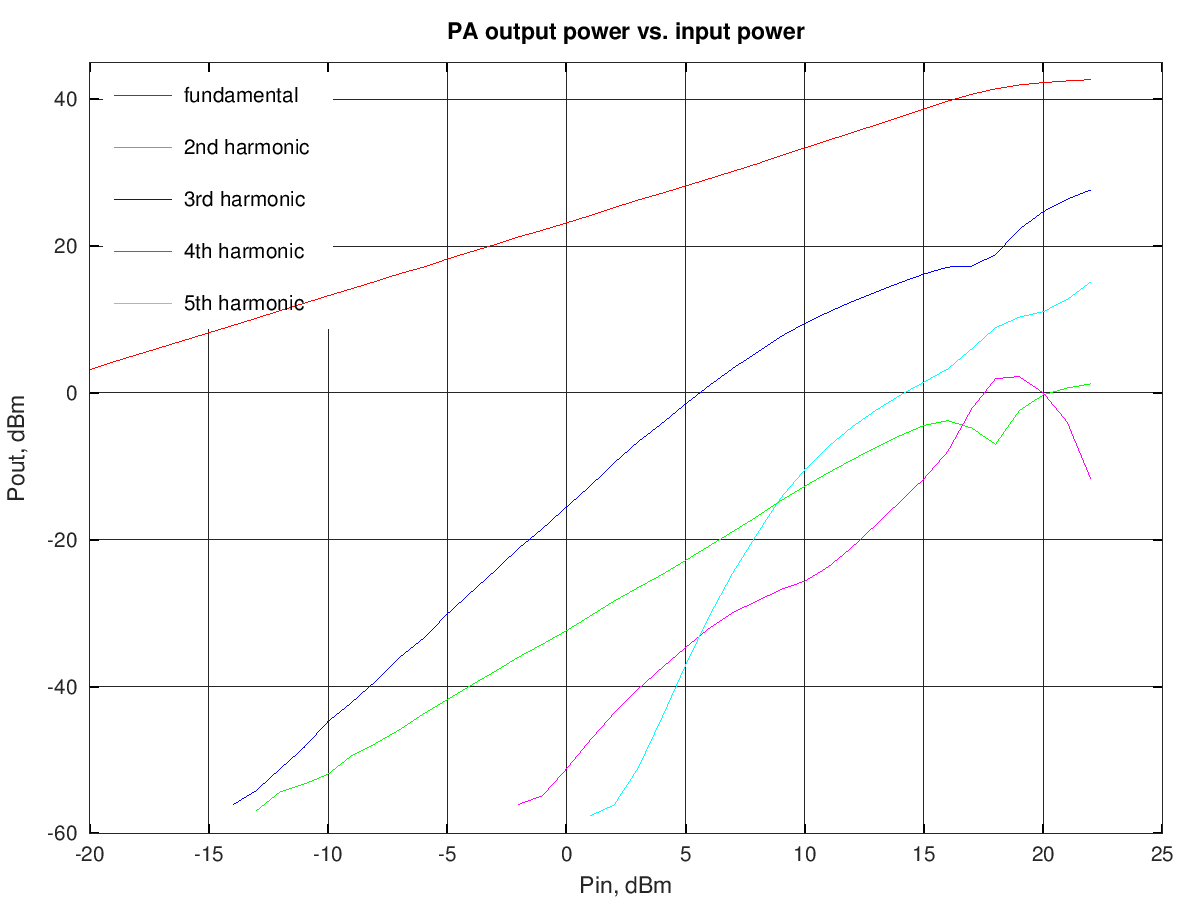
the output power at 1 dB of compression is about 17 W (43.3 dBm).
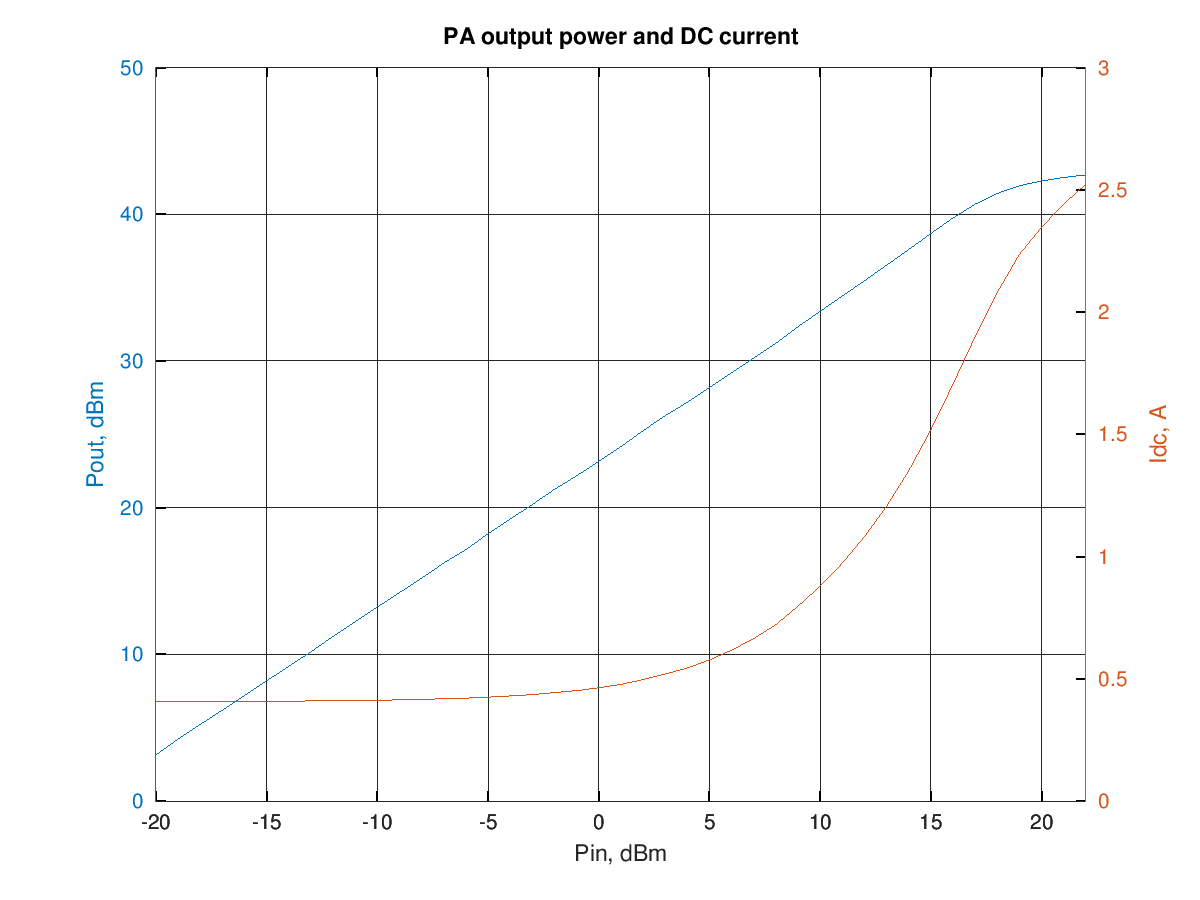
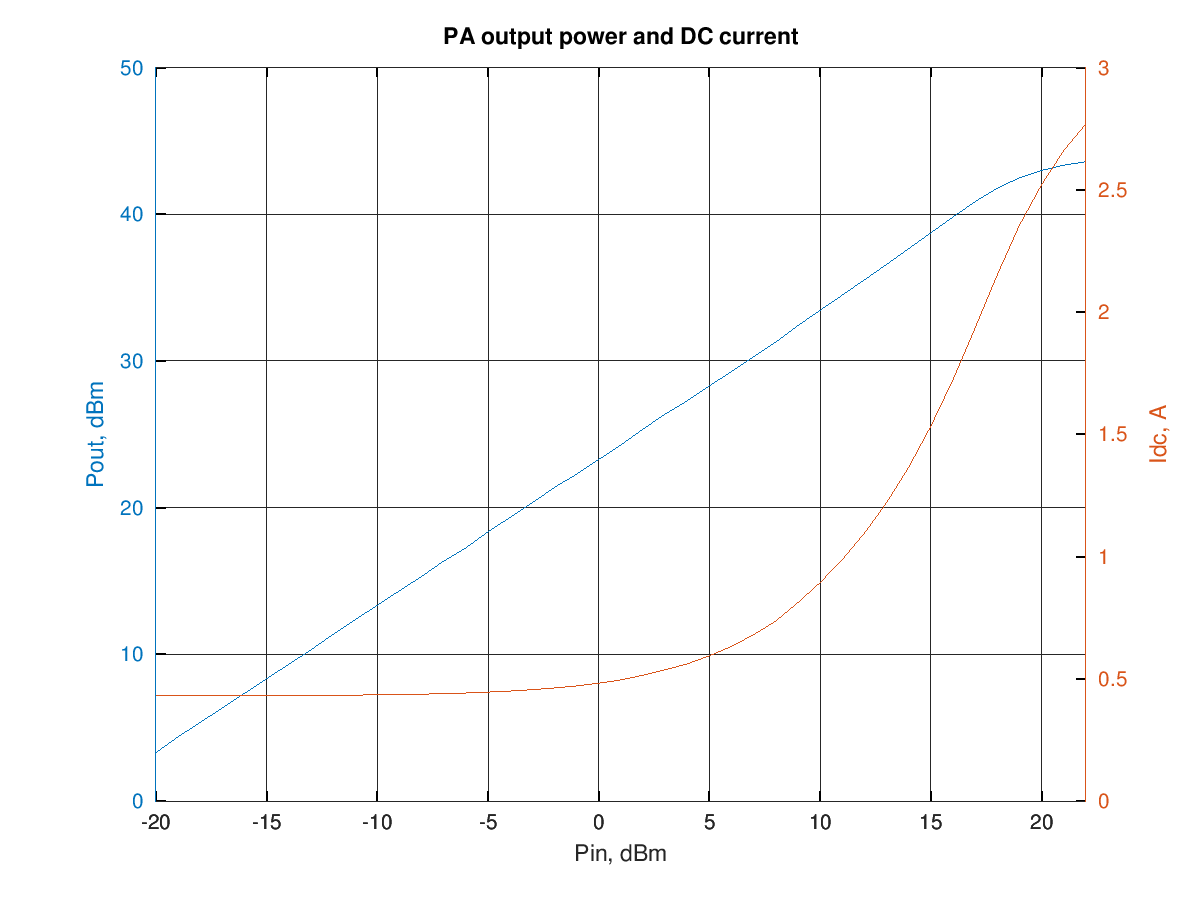
RF output and DC current drawn from the supply versus input power (10 MHz sinewave) are shown in the following graph:
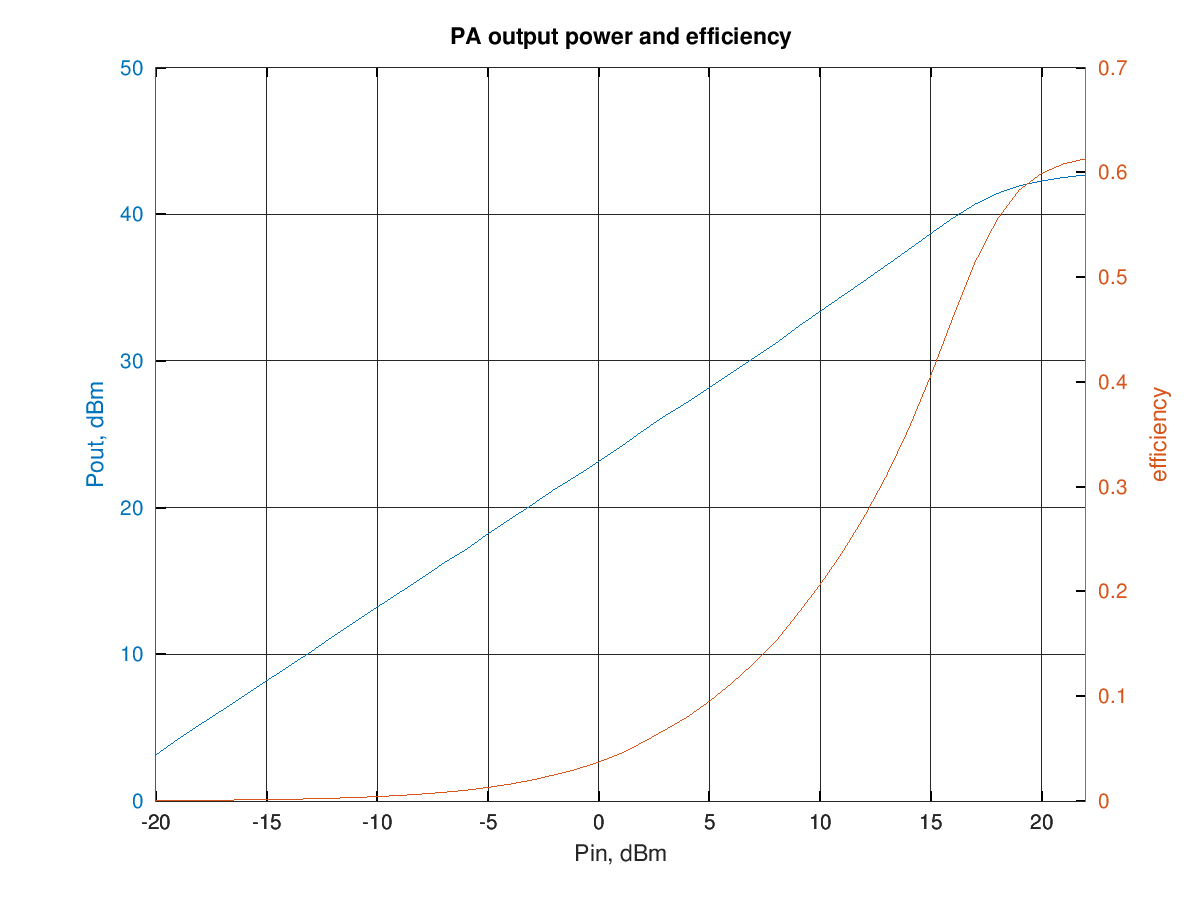
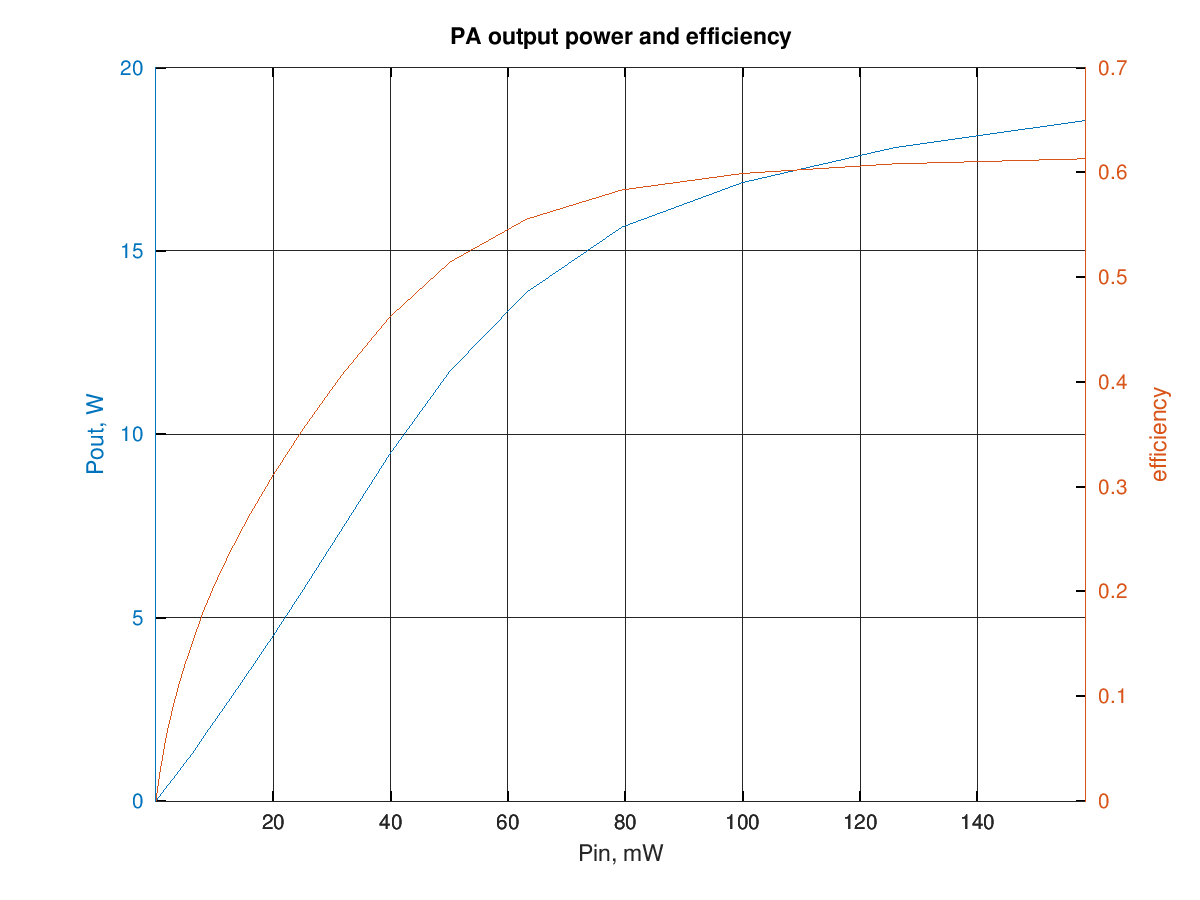
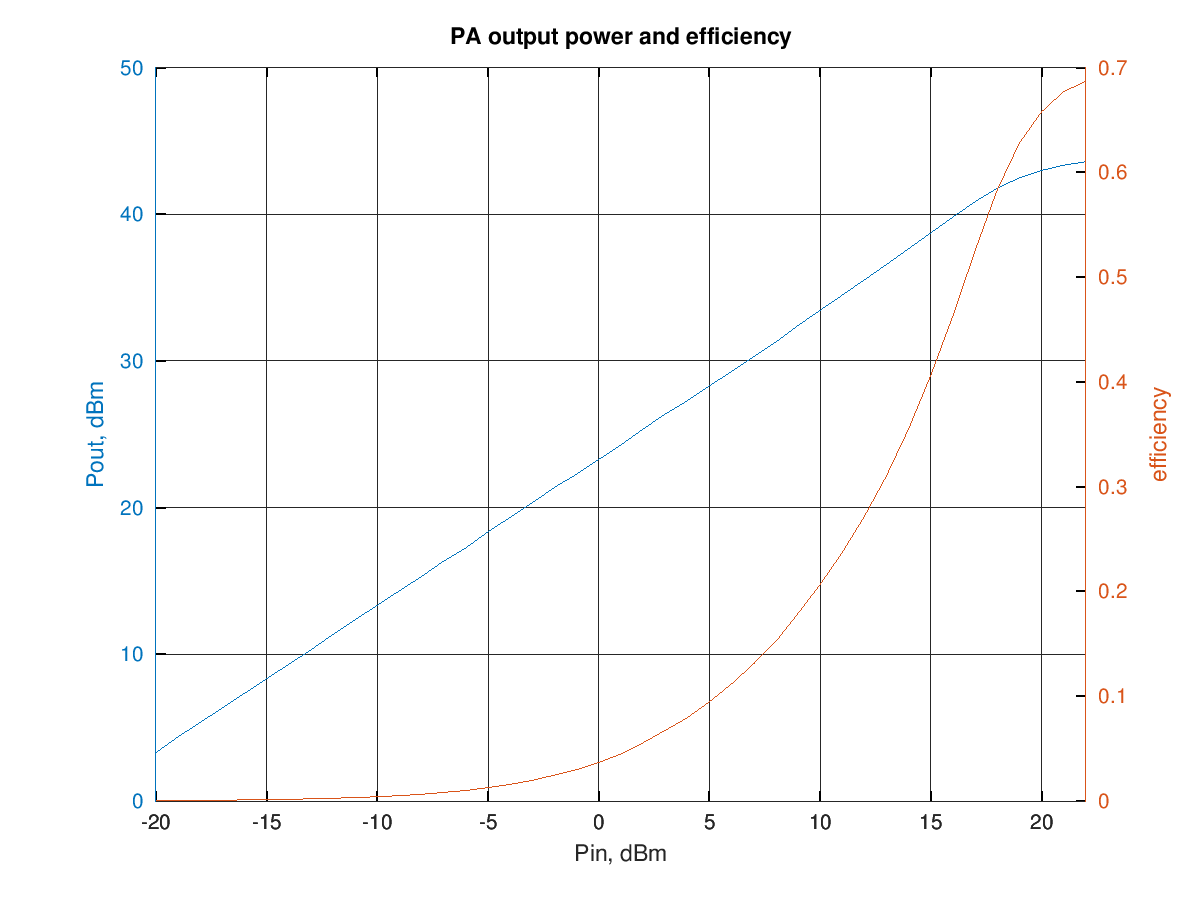
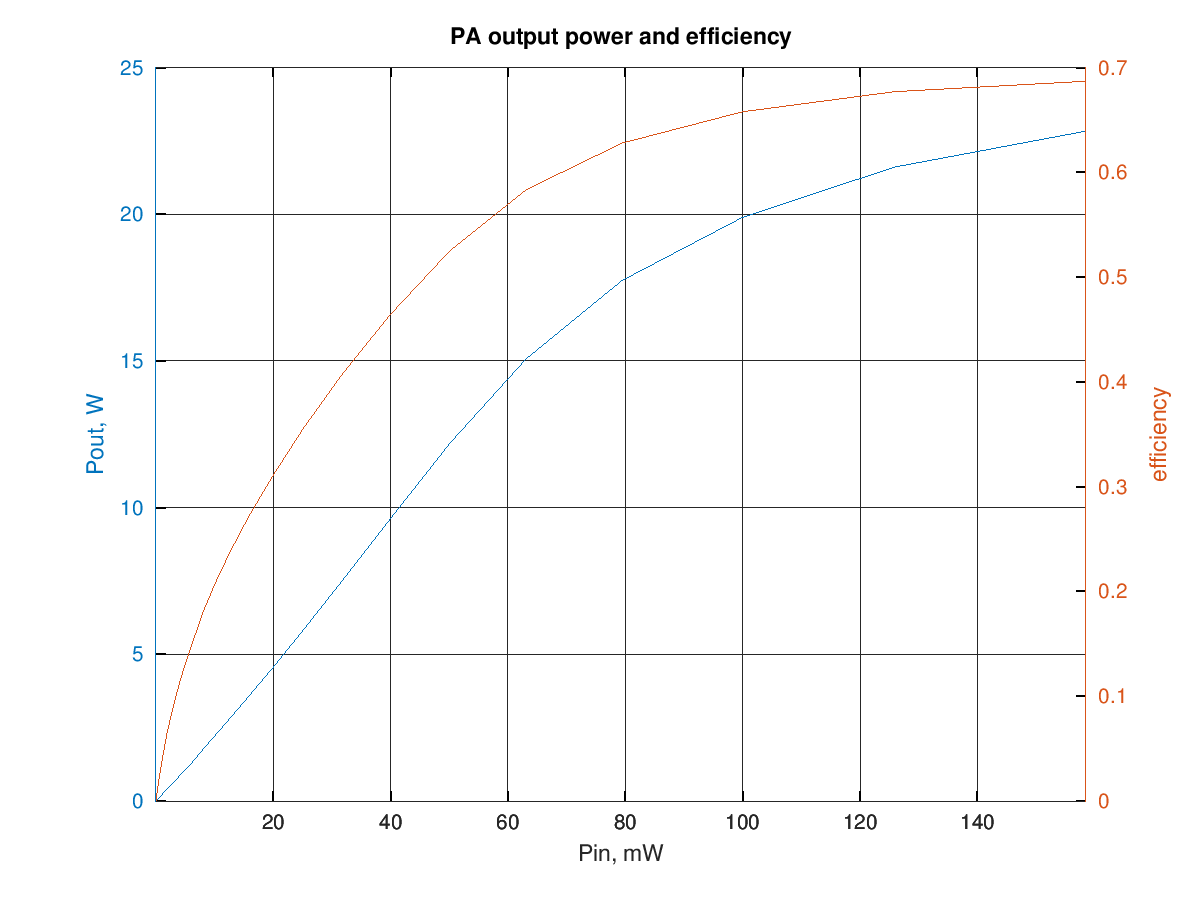
and the resulting efficiency is shown in the graphs below (data are the same for the two graphs, in the first the input and output power are in dBm and in the second they are in watt):
The third-order intermodulation products amplitude w.r.t the output power per-tone is shown in the graph below (to obtain the actual [average] output power multiply the value by two, to have the PEP, multiply by 4):


at an IM3 of -30 dBc the output power is around 4.2 W per tone.
The graph below shows the relative amplitude of the IMD products (separately for upper and lower products) for a two-tone test with varying tone spacing at 16.8 W PEP output:

there is an increase in the intermodulation levels around 15 kHz, probably due to some resonance in the power supply or input filter circuitry.
PA output at Vdd=13.6 V
The PA was powered using a 13.6 V regulated supply.
The fundamental and harmonics output levels versus input power, with a 10 MHz sinewave input, are shown in the graph below:
the output power at 1 dB of compression is about 17 W (43.3 dBm).
RF output and DC current drawn from the supply versus input power (10 MHz sinewave) are shown in the following graph:
and the resulting efficiency is shown in the graphs below (data are the same for the two graphs, in the first the input and output power are in dBm and in the second they are in watt):
The third-order intermodulation products amplitude w.r.t the output power per-tone is shown in the graph below (to obtain the actual [average] output power multiply the value by two, to have the PEP, multiply by 4):


at an IM3 of -30 dBc the output power is around 5.35 W per tone.
The graph below shows the relative amplitude of the IMD products (separately for upper and lower products) for a two-tone test with varying tone spacing at 22.5 W PEP output.
Note that this measurement was done at 1.8 MHz

there is an increase in the intermodulation levels around 15 kHz, probably due to some resonance in the power supply or input filter circuitry.