 Current Ham Band Conditions
 Forecast Ham Band Conditions
Which Ham Bands are open now?
How to read propagation charts?
Explained maps, charts and tools
Locate DX openings using propagation charts:
- Long-range ham radio communication relies on skywave propagation.
- Skywave band conditions shift constantly by the minute and across longer timeframes.

- Factors like time of day, solar activity, and ionospheric conditions drive these changes.
- Propagation charts visually aid in signal clarity estimation and long-distance communication potential by highlighting factors like MUF, solar flux, geography, and geomagnetic activity.
- The following propagation charts explain how and when certain communication paths might open or close.
|
Regional Propagation Maps
based on ham activity and ionosondes. Pros: Shows geographical distribution Cons: No explicit signal disruptions Recent Ham Activity (last 15 minutes)
 real-time reports on 11 bands (160—6 m). Recent MUF Conditions (last 15 minutes)
 Iso-frequency contours of 8 ham bands based on data from ionosondes. The predicted Regional LUF Conditions
 Global map of the recent LUF shows the predicted attenuation from 3 to 35 MHz due to solar and spaceweather events. Point-to-Point 24-hour forecast—HF planner
|
Global Conditions Charts
based on solar-terrestrial data. Pros: Signal disruption indicators Cons: No geographical distribution Recent R-S-G reports  Solar flares | Online Space weather reports |

The charts explained below provide a visual representation of amateur radio band activity, helping operators with band usage.
Real-time radio propagation from active stations
- DXView: A real-time map of worldwide ham activity on HF bands designed by Jon Harder, NG0E.
Figure 1: Real-time Ham Band ActivityThis map hints at ham band conditions across the globe, refreshing every 15 minutes. It tracks real-time activity on 11 bands ranging from 1.8 to 54 MHz. Data comes from reliable sources, including DX Cluster, WSPRnet, RBN ↗, and PSK reporters (CW, FT4, FT8). Some of these reporters offer information on the signal-to-noise ratio (SNR) levels. The DXView website provides a guide on interpreting the map and selecting band colors.
Clarifications:
- This map uses data from clusters updated once every minute.
- MUF (Maximum Usable Frequency) is the highest frequency that allows for two-way communication. Given that the display is based on real-time data, MUF can be considered the highest frequency used on this map.
- The map indicates reported SNR levels (dB) with three different shades: SSB (SNR > 10), CW (SNR > -1), or digital modes (SNR > -28).
Spotting recent activity up to 60 minutes from all continents
See below a demo of "Spots from All Continents" showing ham-band activity across 13 bands, 160 meters to 70 centimeters.
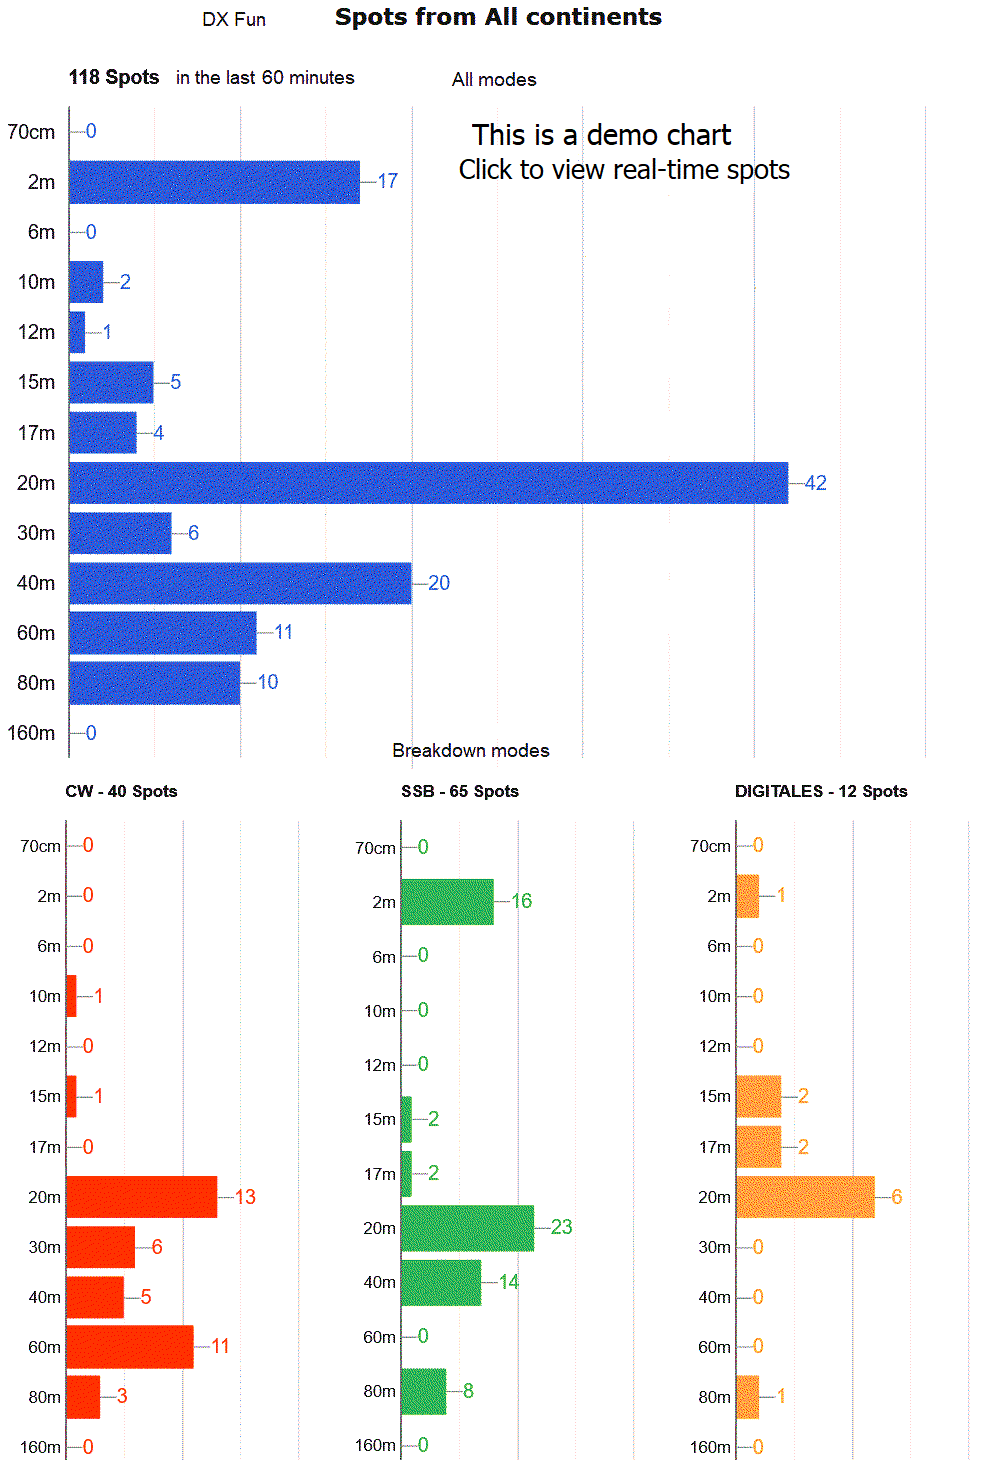
Figure 2: A demo: Real-time Ham Band Active Spots
from all continents; all modes and breakdown of modes (CW, SSB, and digital)
Click on the above chart to view real-time data courtesy DXFun, by EC4DX-Javier, EA3EXV-Gerard, EB5IPG-Luis.
- The MUF3000 map below shows ham band propagation conditions in the past 15 minutes,
Figure 3: MUF 3000 km Propagation Map, by Andrew, KC2G
This map does not account for terrain, or soil type.This map offers a quick visual snapshot of current DX conditions on 8 ham bands (60, 40, 30, 20, 17, 15, 12, 10 m) marked by iso-frequency contours. The map shows MUF (Maximum Usable Frequency) levels across different regions, based on data from ionosondes. Each region’s MUF is represented by a numbered, colored disc, indicating the highest frequency suitable for long-distance (3,000 km) communication. Read more.
- Explore additional real-time maps and charts (NVIS, MUF, and LUF), each with a clear explanation.
- Monitoring Propagation: Stay updated on real-time changes in propagation conditions by regularly checking HF band activity. Consider integrating insights from multiple sources with the data presented in these maps for a more comprehensive understanding.
Real-time ionospheric probing
Forecasting Tools
Radio propagation forecasts help radio operators optimize communication by determining the best frequencies and times to make contact with specific destinations.
For example, Andrew D. Rodland, KC2G, offers a free application called "HF Propagation Planner." This is an HF propagation planning and forecasting tool, similar to Proppy's Radcom Predictions. While prediction tools rely on "global monthly average" ionospheric conditions, this planner makes a regional short-term forecast using real-time data. ↗
See an example with explanations.
Odd propagation conditions
Chaotic solar and geomagnetic activity cause "odd" propagation conditions that differ from the "regular" day/night cycle. These "bad" conditions can result in unexpected signal blackouts, as well as "good" conditions on the VHF band.
Conclusion:
HF band condition charts, applications, and tools help operators understand and optimize long-distance communication. The main page, "Understanding HF Propagation," provides real-time data, forecasts, and extended tutorials that make skywave propagation easier to understand. Short web pages divided by subtopics also explain the full range of topics, as shown in the following links:
How to read propagation charts
Understanding Radio Propagation
HF propagation forecast bulletin
Shortwave propagation bulletin
Space weather status and alerts
HF propagation status and alerts
Real time radio propagation map
Understanding ham bands closed
The current ham band conditions
HF propagation seasonal anomaly
Understanding propagation charts
Current ham radio HF propagation
HF radio propagation search terms
HF propagation for hams explained
Current solar conditions ham radio
Radio propagation seasonal anomaly
Disrupted HF propagation conditions
Current radio propagation conditions
Current Ham band conditions—charts
How to read propagation charts for HF
Radio propagation for hams explained
Skywave propagation seasonal anomaly
HF propagation Global Conditions Charts
Why is there no activity on the HF Radio?
Skywave propagation for hams explained
Usable Frequency Range from LUF to MUF
Current ham radio propagation conditions
What does it mean when a band is closed?
HF propagation Regional Propagation Maps
Global Conditions Charts of HF propagation
A useful guide for amateur radio operators
Explain what does it mean ham bands closed
How to read propagation charts for HF DXing
Real-time watching of worldwide ham activity
Regional Propagation Maps of HF propagation
Propagation of radio waves explained
How does the sun affect radio communication?
Window of usable frequencies from LUF to MUF
The fascinating world of HF skywave propagation
Real-time watching of worldwide activity of hams
Amateur Radio Propagation Conditions Overview
Current ham band conditions—charts for radio hams
Current HF band conditions maps for radio operators
Current Ham band conditions maps for radio operators
Accumulate the latest HF band conditions from various sources
Provide interpretation charts for better HF band communication
Utilize NOAA Space Weather Prediction Center's prediction data
Provide a real-time HF propagation map for all HAM radio operators
Find the right band, time, and mode for various amateur radio bands
Explain amateur radio propagation and current solar and geomagnetic status
Discover current solar and atmospheric conditions for ham radio propagation
Learn to interpret maps, charts and banners for better HF band communication
Discover current propagation conditions for ham radio operators using maps and charts
24-hour forecast for point-to-point communication circuit
and the QRZ site since August 17, 2022,
sorted by visitors marked with their flags.
Repeat visits counted as new after 24 hours.