
 HF Propagation Forecast
HF Propagation Forecast Overview
- Long range ham radio communication relies on skywave propagation.
- Skywave band conditions shift constantly by the minute and across longer timeframes.

- Factors like time of day, solar activity, and ionospheric conditions drive these changes.
- Propagation charts visually aid in signal clarity estimation and long-distance communication potential by highlighting factors like MUF, solar flux, geography, and geomagnetic activity.
- By interpreting propagation charts, users can forecast how and when certain communication paths might open or close.
Propagation Forecast Charts based on recent conditions
|
Regional Propagation Maps
based on ham activity and ionosondes Pros: Shows geographical distribution Cons: No explicit signal disruptions Recent Ham Activity (last 15 minutes)
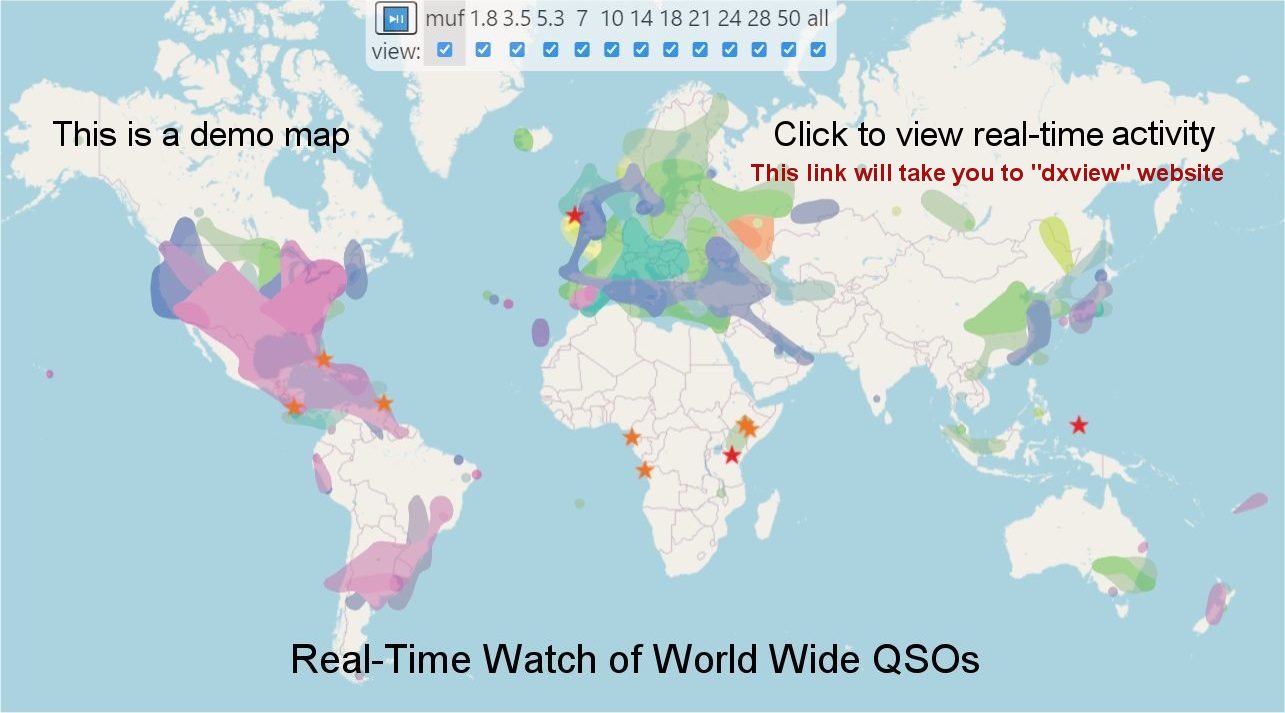 real-time reports on 11 bands (160—6 m). Recent MUF Conditions (last 15 minutes)
 Iso-frequency contours of 8 ham bands based on data from ionosondes. The predicted Regional LUF Conditions
 Global map of the recent LUF shows the predicted attenuation from 3 to 35 MHz due to solar and spaceweather events. Point-to-Point 24-hour forecast—HF planner
|
Global Conditions Charts
based on solar-terrestrial data. Pros: Signal disruptions at a glance Cons: No geographical distribution Recent R-S-G reports  Solar flares | More Space weather reports |

Forecasting vs. Prediction
The terms forecasting and prediction differ primarily in their time frames and methodologies.
- Forecasting: Short-term estimations based on current data (e.g., "Conditions will improve in the next hour").
- Prediction: Long-term estimates based on trends (e.g., "Better 40-meter conditions expected next month").
Evolution of forecasting techniques
Remarkable advancements in space technology ↗, software-defined radio (SDR) ↗, and the internet have revolutionized our understanding of radio wave propagation. Before the 1990s, propagation charts and reports were often published in amateur radio magazines. Today, real-time solar indices and computer programs provide accurate, up-to-the-minute propagation data using online tools ↗.
Space weather status and alerts
How to read propagation charts
HF propagation status and alerts
Real time radio propagation map
HF propagation for hams explained
Current solar conditions Ham radio
Current Ham Radio HF Propagation
HF Radio Propagation Search Terms
Disrupted HF propagation conditions
Understanding propagation charts
How to read propagation charts for HF
Radio propagation for hams explained
Current HF Band Conditions Online Map
HF propagation Global Conditions Charts
Skywave propagation for hams explained
Current Ham Radio Propagation Conditions
Global Conditions Charts of HF propagation
HF propagation Regional Propagation Maps
How to read propagation charts for HF DXing
Real-time watching of worldwide ham activity
Regional Propagation Maps of HF propagation
Propagation of radio waves explained
How does the sun affect radio communication?
Real-time watching of worldwide activity of hams
The Fascinating World of HF Skywave Propagation
Current HF Bands Conditions—Charts for Radio Hams
Current HF Band Conditions Maps For Radio Operators
24-hour forecast for point-to-point communication circuit
What is the difference between solar indices and propagation indices?