
 LUF Propagation Map (Chart)
What is LUF? | Online LUF chart
During the day, the ionospheric D region absorbs skywaves below ~10 MHz:
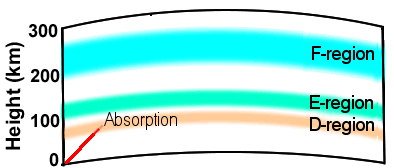
Figure 1: Daytime Low HF absorption below 10 MHz
The lowest frequency at which two radio stations can connect is known as the LUF. It is dependent on ionospheric conditions due to solar flare, solar wind, geomagnetic activity, as well as path factors (such as transmitting power and receiving SNR). These variables collectively complicate mapping efforts. Figure 3 illustrates the attenuation resulting from solar flares, and solar energetic particle (SEP) events over the past eight hours. The LUF is mostly determined by the D region.
LUF, also known as the "absorption-limited frequency" (ALF or FL), is a soft frequency limit, unlike the sharp cut-off of the MUF.
At night there is no low frequency limit.
- MUF and LUF change cyclically every 24 hours:

Figure 2: Typical diurnal cycle based on Naval Postgraduate School training materialsFMUF: F region maximum usable frequency
OWF: The optimum working frequency is usually 85% of the MUF.
EMUF: E region maximum usable frequency
LUF: The lowest usable frequency due to D-region absorption. - During a solar flare, the LUF may rise swiftly, narrowing the usable HF skywave window.
- Strong Solar flare bursts ↗ can produce blackouts for minutes to hours.
Understanding these variations is crucial for effective HF radio communication, as it helps select the optimal transmission frequency.
Worldwide LUF map
The folowing chart uses empirical relationships to calculate HF absorption by the D region, based on space weather conditions:

Figure 3: The predicted attenuation of skywaves (from 3 to 35 MHz) due to D region absorption by flares or SEP
Click on the figure to view an animation over the last eight hours, courtesy of NOAA/SWPC.
This chart (known as D-RAP model) helps understand HF radio fadeouts and blackouts by providing graphical and textual information on global HF propagation conditions.
Electron density in the D region, which can vary within minutes, directly affects the Lowest Usable Frequency (LUF). Find complementary information here.
 LUF (ALF) chart provided by the Australian Space Weather Alert System
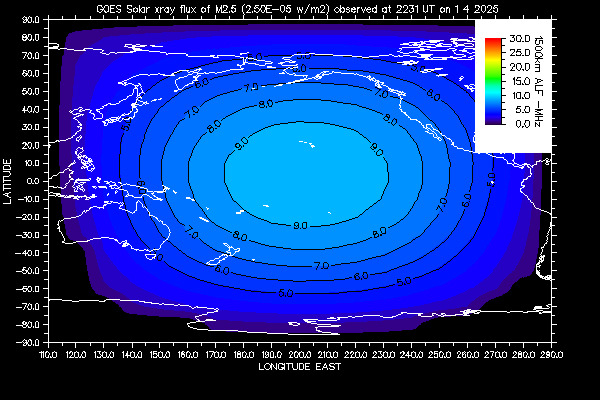
Figure 4: LUF (ALF) chart by ASWFC ↗
The top line of this chart highlights the recent major flare time.
This map illustrates the lowest usable frequency (LUF) affected by the recent solar X-ray flare above M1 class. As shown by the color bar, the most significant impacts occur within the inner circle. The map reflects the LUF for standard 1500 km HF circuits, where communication below the LUF is uncommon, while communication above it is generally possible. Shorter circuits may exhibit higher LUF values, enabling the use of lower frequencies. Conversely, longer circuits might still experience signal fading, even at elevated frequencies.
Read more about LUF propagation map.
Listen to the Shortcast: The Fascinating World of HF Skywave Propagation.
Real time radio propagation map
Current solar conditions Ham radio
Current Ham Radio HF Propagation
HF propagation status and alerts
HF Radio Propagation Search Terms
HF propagation for hams explained
How to read propagation charts
Understanding propagation charts
How to read propagation charts for HF
How to read propagation charts for HF DXing
Radio propagation for hams explained
What is Radio Communication Circuit?
Current HF Band Conditions Online Map
Current Ham Radio Propagation Conditions
Real-time watching of worldwide ham activity
How does the sun affect radio communication?
Real-time watching of worldwide activity of hams
The Fascinating World of HF Skywave Propagation
Current HF Bands Conditions—Charts for Radio Hams
Current HF Band Conditions Maps For Radio Operators
The Path of Wireless Communication
Introduction to Wireless Communications
HF propagation Global Conditions Charts
HF propagation Regional Propagation Maps
Global Conditions Charts of HF propagation
Regional Propagation Maps of HF propagation
Propagation of radio waves explained
24-hour forecast for point-to-point communication circuit