
 HF Propagation Today
Useful charts showing HF propagation today
|
 The following online activity map designed by Jon Harder, NG0E shows real-time QSOs on 11 HF bands.
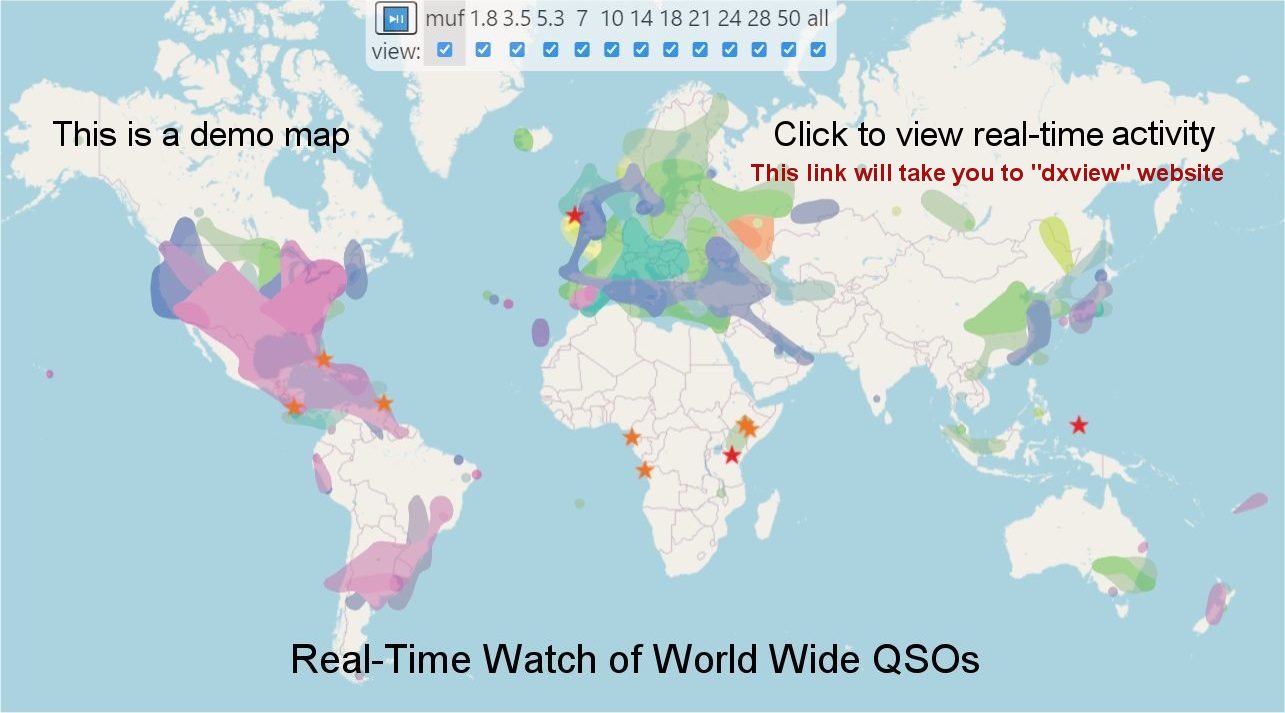
Figure 1: DXView of real-time QSOs, on a selected band, or on all bands
First click on the above map; then you may click on "Perspective" filling in your QTH location.
The DXView map helps identify open bands and communication modes↗ based on real-time activity from the last 15 minutes. It compiles data from online sources: WSPRnet, RBN ↗ (CW, FT4, FT8), and DX Cluster. Signal-to-Noise Ratio (SNR) ↗ data determines if a path supports SSB (SNR > 10 dB), CW (SNR > -1 dB), or only digital modes (decoding down to about -28 dB SNR). The DXView website provides a guide on interpreting the map and selecting band colors.
Propagation DX map
The solar radiation and space weather affect HF propagation.
The following MUF 3000 km map designed by Andrew, KC2G, shows near real-time HF propagation conditions for a 3000 km path.

Figure 2: MUF 3000 km map designed by Andrew, KC2G
1. How to use this online map 2. Additional notes 3. Animated map
Global HF Score
 Real-time propagation conditions by HF Activity Group ↗ Real-time propagation conditions by HF Activity Group ↗
The bar above represents the global "HF score" for the high bands: 17m, 15m, 12m, and 10m. It updates every 5 minutes based on global propagation indices. Regional or local conditions may be quite different. The HF score graph below demonstrates fluctuations over time (UTC), indicating varying levels of solar and geomagnetic activity. Peaks indicate good (global) propagation conditions, while dips indicate poor conditions. The red line represents a 48-hour global trend for reference. |
Rapid changes in the global HF propagation conditions are primarily due to variations in the ionosphere, which is affected by solar activity and geomagnetic storms. These factors influence the ionosphere's ability to bounce skywaves, leading to changes in signal strength, signal-to-noise ratio, coverage, and the potential for skip zones. Read more.
Regional fluctuations
Below, see complex regional changes of the propagation conditions referred to the global average.
The T index indicates the recent regional conditions (15 minutes) in relation to the worldwide average from the preceding month.
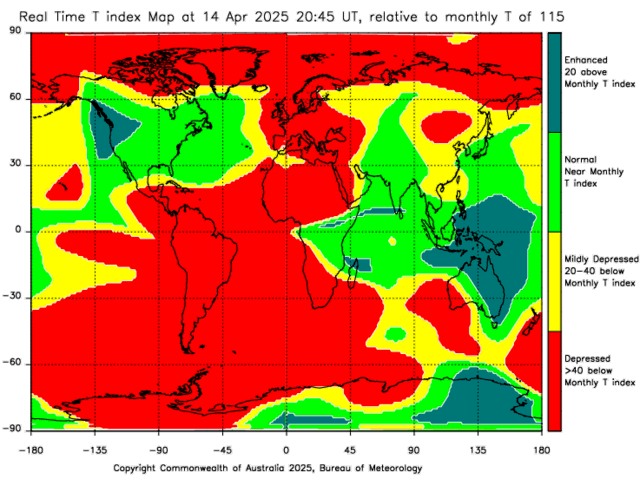
Click on Figure 4 to read explanations.
The HF Propagation page provides detailed overview and tutorials on additinal aspects of HF propagation.
How to read propagation charts
HF Propagation Forecast Bulletin
Shortwave propagation bulletin
Understanding propagation charts
How to read propagation charts for HF
How to read propagation charts for HF DXing
Amateur Radio Propagation Today
Shortwave Radio Propagation Today
How to Read Propagation Charts for HF DXing?
The Fascinating World of HF Skywave Propagation
HF propagation Global Conditions Charts
HF propagation Regional Propagation Maps
Global Conditions Charts of HF propagation
Regional Propagation Maps of HF propagation
Propagation of radio waves explained
and the QRZ site since August 17, 2022,
sorted by visitors marked with their flags.
Repeat visits counted as new after 24 hours.