IN3OTD's web site
...under perpetual construction.

Hermes-Lite SDR - RX measurements
Measurement on the Hermes-Lite RX using the frontend 1.2 without any input filter.
Main sections:
- noise floor and birdies
- gain vs gain steps and frequency
- third-order intermodulation
- second-order intermodulation
Unless otherwise noted, the audio filter used had a bandwidth of 500 Hz and was centered at 1 kHz.
RX birdies search
To find out if there were any RX frequencies affected by spurs, the Minimum Discernible Signal (MDS) was measured every 500 Hz. The standard procedure - connecting a signal generator to the RX input and adjusting its output power to obtain an increase of the audio output of 3 dB - was done automatically via a script, which adjusted iteratively the generator level until it was within 0.5 dB of the 3 dB increase, for every frequency tested.
The measured MDS over frequency, for an RxPGA gain of 19 dB is show in the following graph:
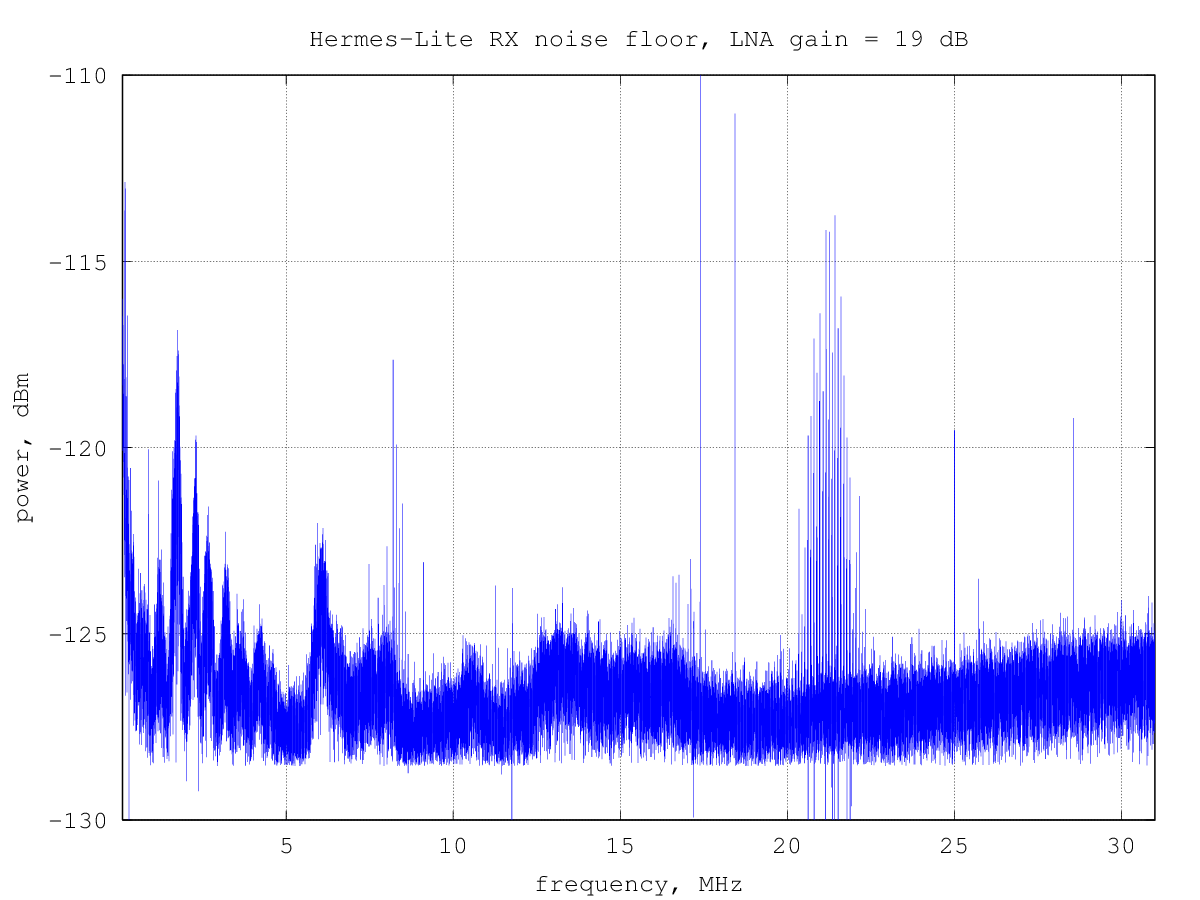
the corresponding data file with all the measured points is available here.
From the graph, some increase in the noise floor, likely due to the power supplies can be seen, together with a few birdies. Note that a couple of peaks are actually measurement artifacts.
Since measuring the MDS with the standard method of adjusting the external signal generator level is quite time consuming, even when automated, the noise floor was also measured in a simpler way, recording the noise power over frequency and then injecting a known signal to determine the actual overall RX chain gain, so that the measured audio power could be referenced to the antenna input.
Measuring the RX noise floor in this way gives the following graph:
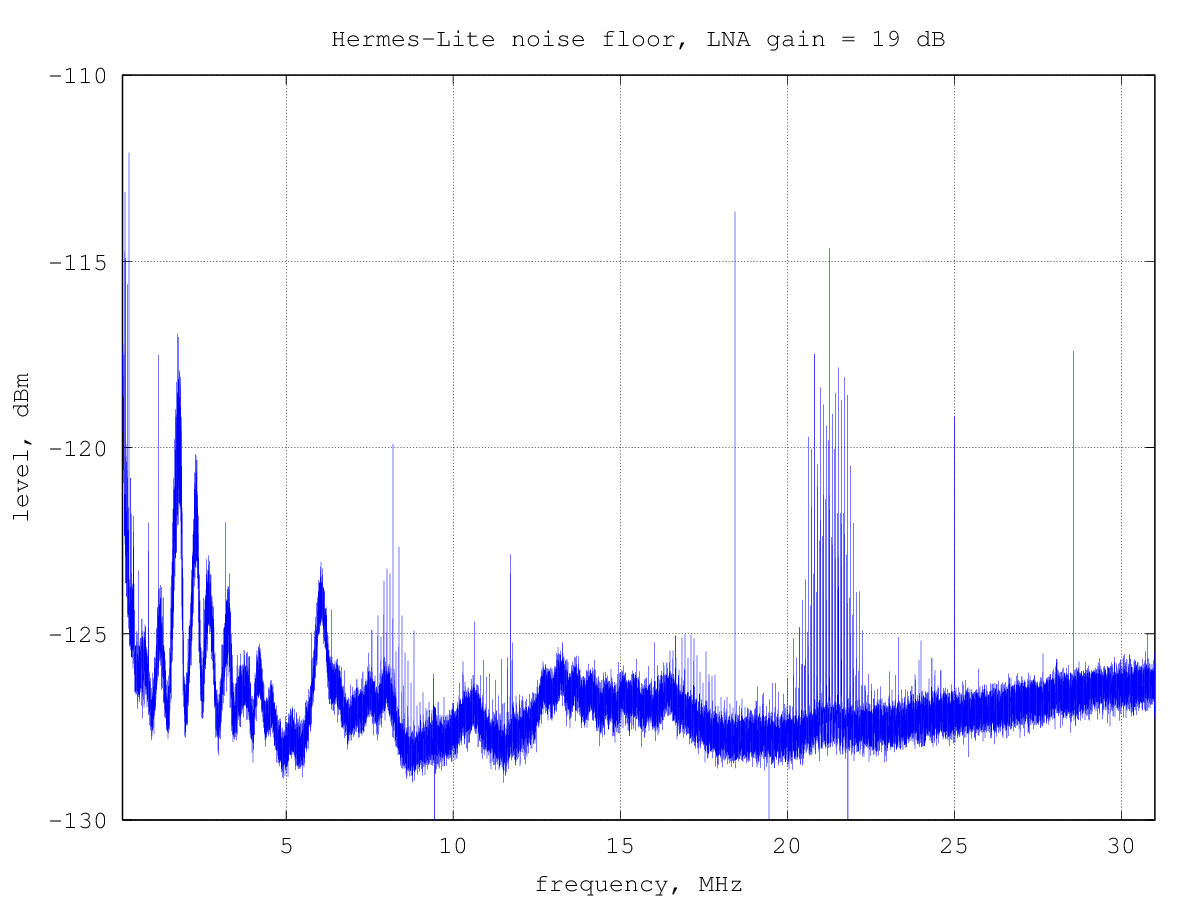
which is very similar to the previous one, except maybe for a couple of measurement artifacts missing and less noise on the results, since the uncertainty of ±0.5 dB of the generator output level is not present when measuring the MDS in this way.
Noise floor vs. RxPGA gain setting
The AD9866 internal RX amplifier (RxPGA) gain can be programmed to -12 dB to 48 dB in 1 dB steps. Here is the measured RX noise floor for every gain step:
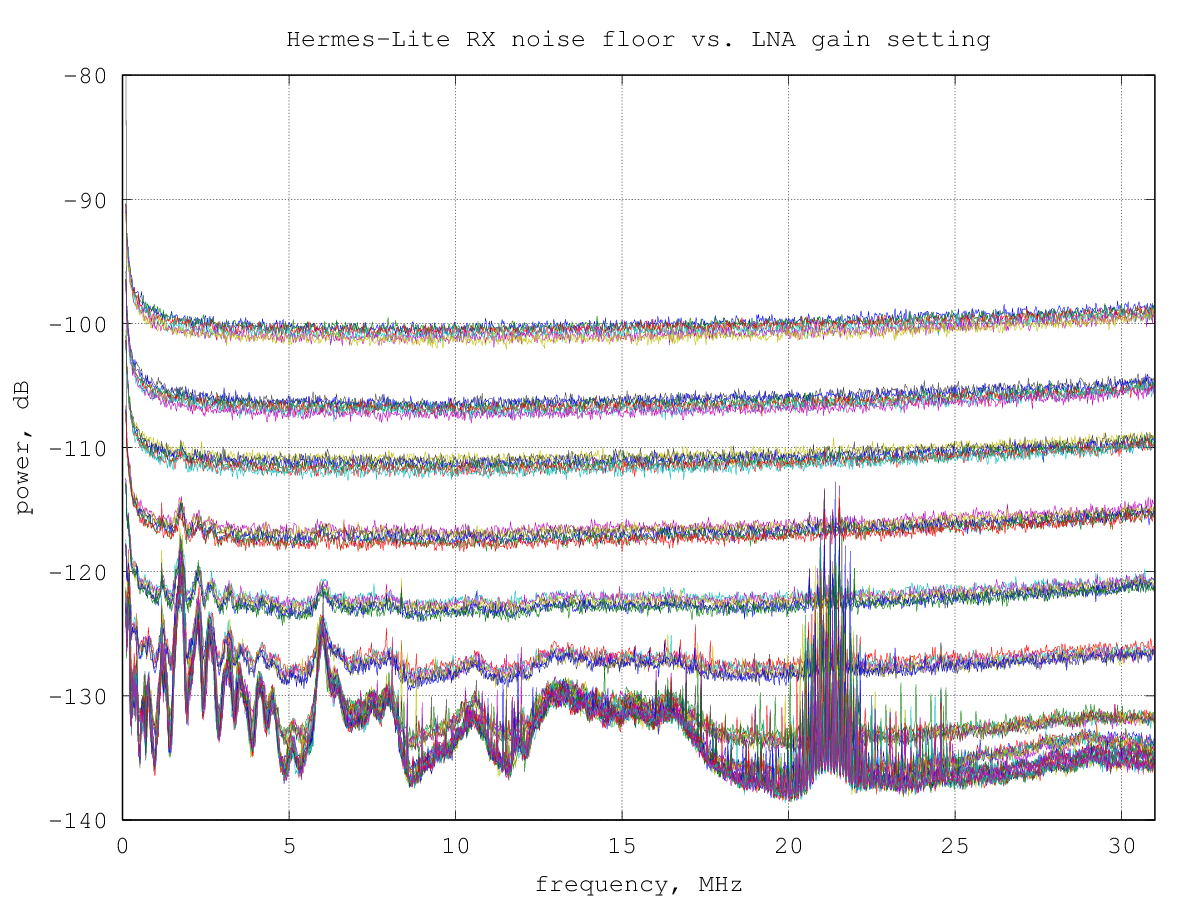
it's interesting to note that several gain steps give practically the same noise floor. This is likely due to the internal RX architecture of the AD9866, where three amplifier stages are cascaded to obtain the overall gain; changing the gain of the first stage has a large impact on the overall noise figure, while changes in the following stages are masked by the noise of the first stage.
Updated noise floor measurement
Some time after the above noise floor measurement I tried to chase down the noise sources responsible for the increased noise floor with the higher gain settings. Sniffing around with a small loop, it didn't take much time to find noise origin: the broadband noise below 20 MHz was caused by the switching "wall wart" powering the BeMicro CV A9 (it was the original one provided with the board) and the broad noise around 21.5 MHz was due to the PC switching power supply.
After powering the Hermes-Lite and BeMicro CV A9 with a linear power supply, providing a better ground for the PC and adding a common-mode choke on the antenna cable, the measured noise floor was looking quite better:
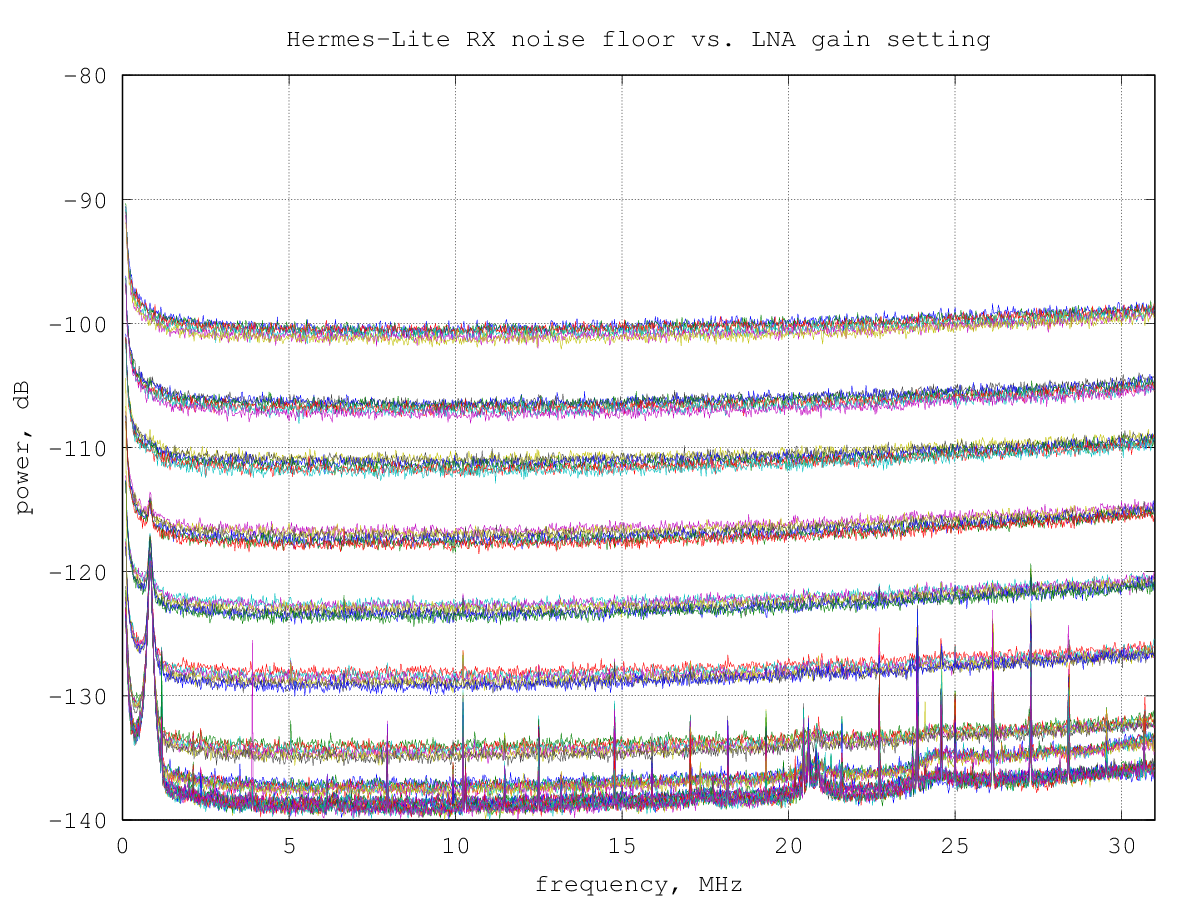
The remaining peak at around 2.3 MHz is generated by the CV A9 board, around the switching power supply; also a few narrow peaks here and there have appeared, but I did not yet have time to take a closer look at these.
We can look at these data also by plotting the RX noise floor vs. the RxPGA gain for a few selected frequencies:
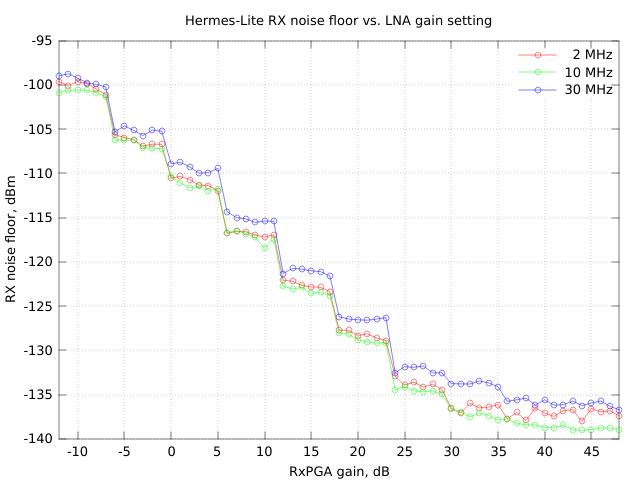
from this graph it's clear that RxPGA gains above 24 dB or 30 dB bring little improvement in the receiver noise floor and, on the other end, will make frontend more prone to IMD.
Noise figure over frequency vs. RxPGA gain setting
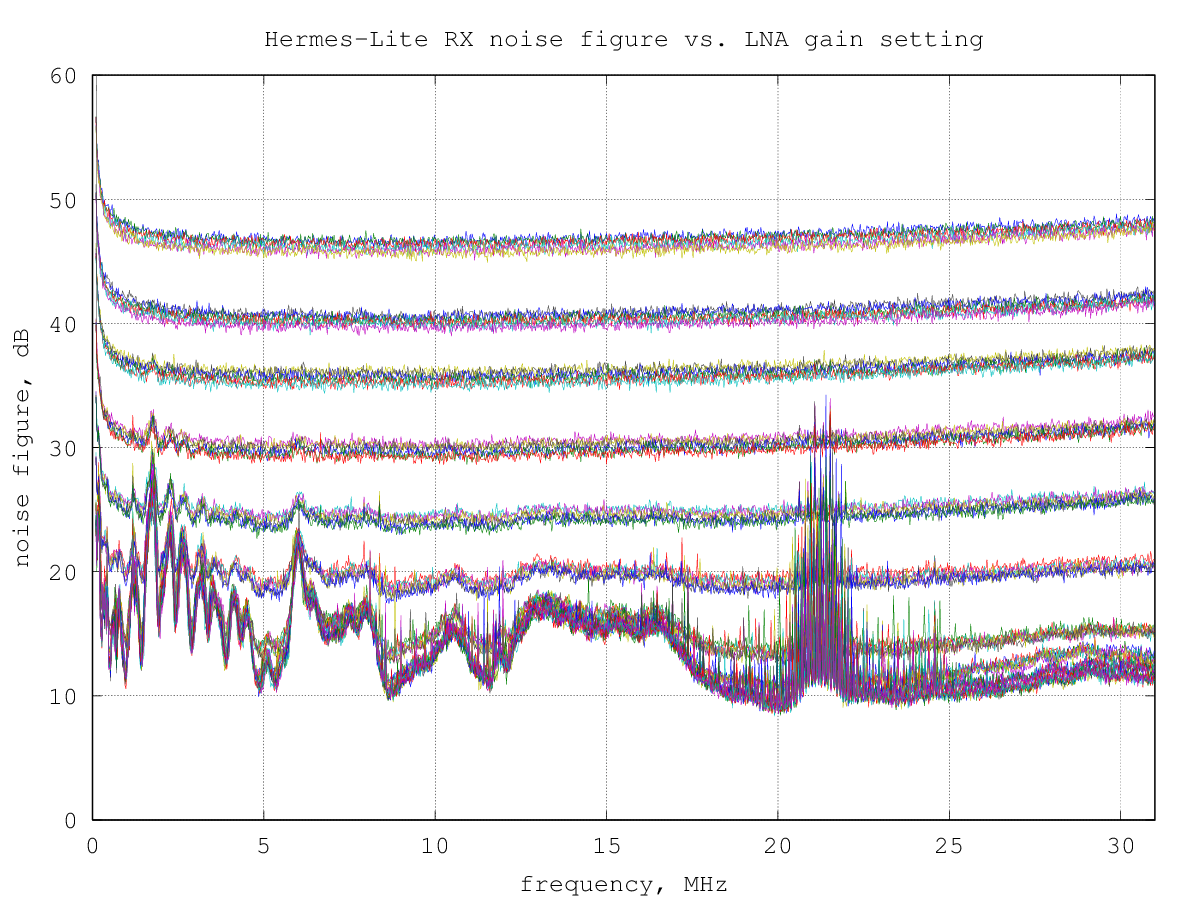
The noise floor data above can be equivalently expressed using the noise figure, which quantifies how much the receiver noise is higher than the theoretical minimum value due to the thermal noise.
The thermal noise floor at ambient temperature is about -174 dBm per hertz of bandwidth; since the measurement bandwidth used was 500 Hz, the thermal noise in this bandwidth is -174+10log(500) = -147 dBm.
By comparing the theoretical thermal noise floor with the measured noise floor, a graph of the noise figure over frequency for the various RxPGA gain steps is obtained:
RX gain over frequency vs. RxPGA gain setting
The following graph shows the RX gain over frequency for RxPGA gain settings from -12 dB to 48 dB, in 1 dB steps.
The 0 dB point has arbitrarily been placed to have 0 dB at 10 MHz with a RxPGA gain setting of 0 dB.
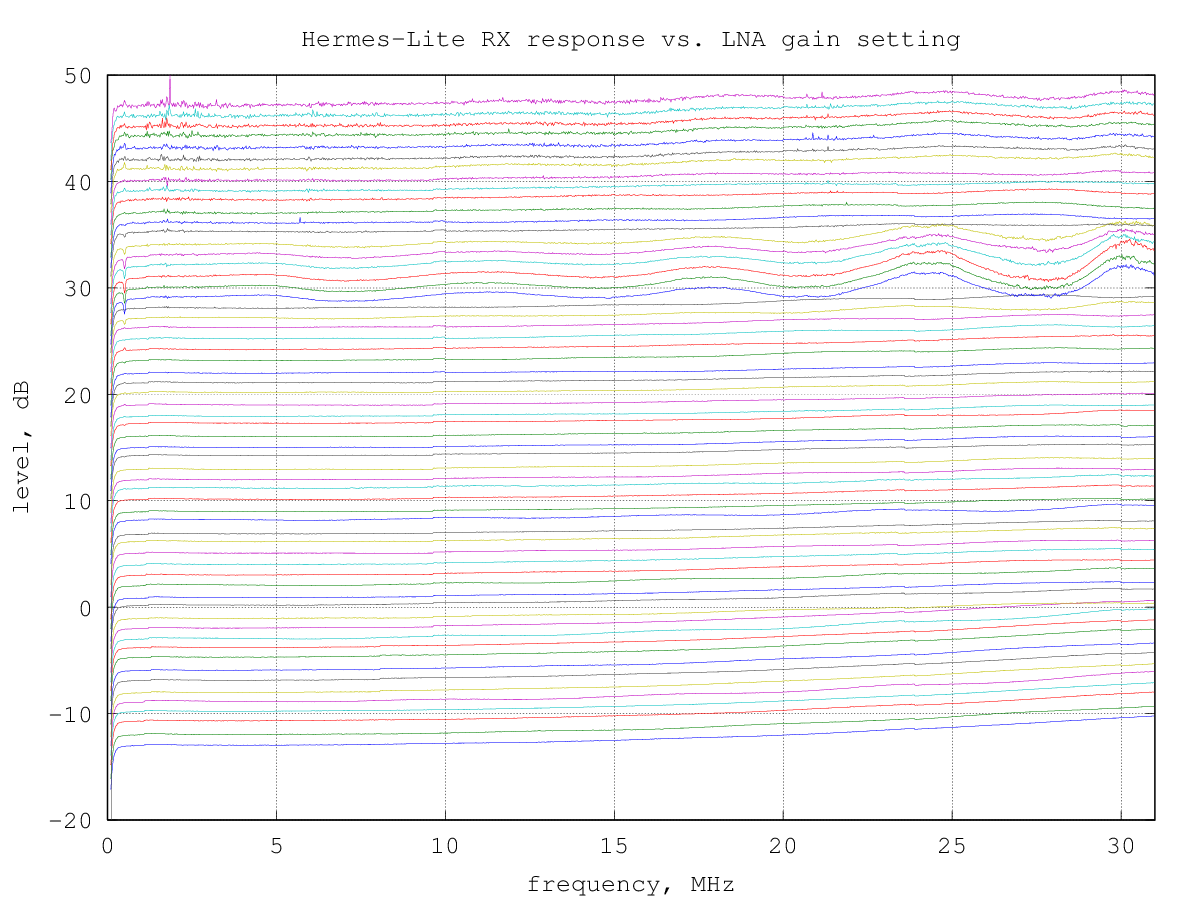
The origin of the ripples in the response at high frequency for some gain settings is unknown; it may be a measurement artifacts, since it's not visible in the noise floor measurements above.
Third-order intermodulation
Third-order intermodulation measurements done with two input tones of equal power and frequencies 9.895 MHz and 9.905 MHz (i.e. mean frequency 9.9 MHz and tone spacing of 10 kHz).
The input tones power was swept from a value equal to the noise floor at the selected gain setting up to the ADC saturation point.
In all the following graphs the input power is per tone.
The following graph shows the measured level of the third-order intermodulation products with the RxPGA gain set to 19 dB:
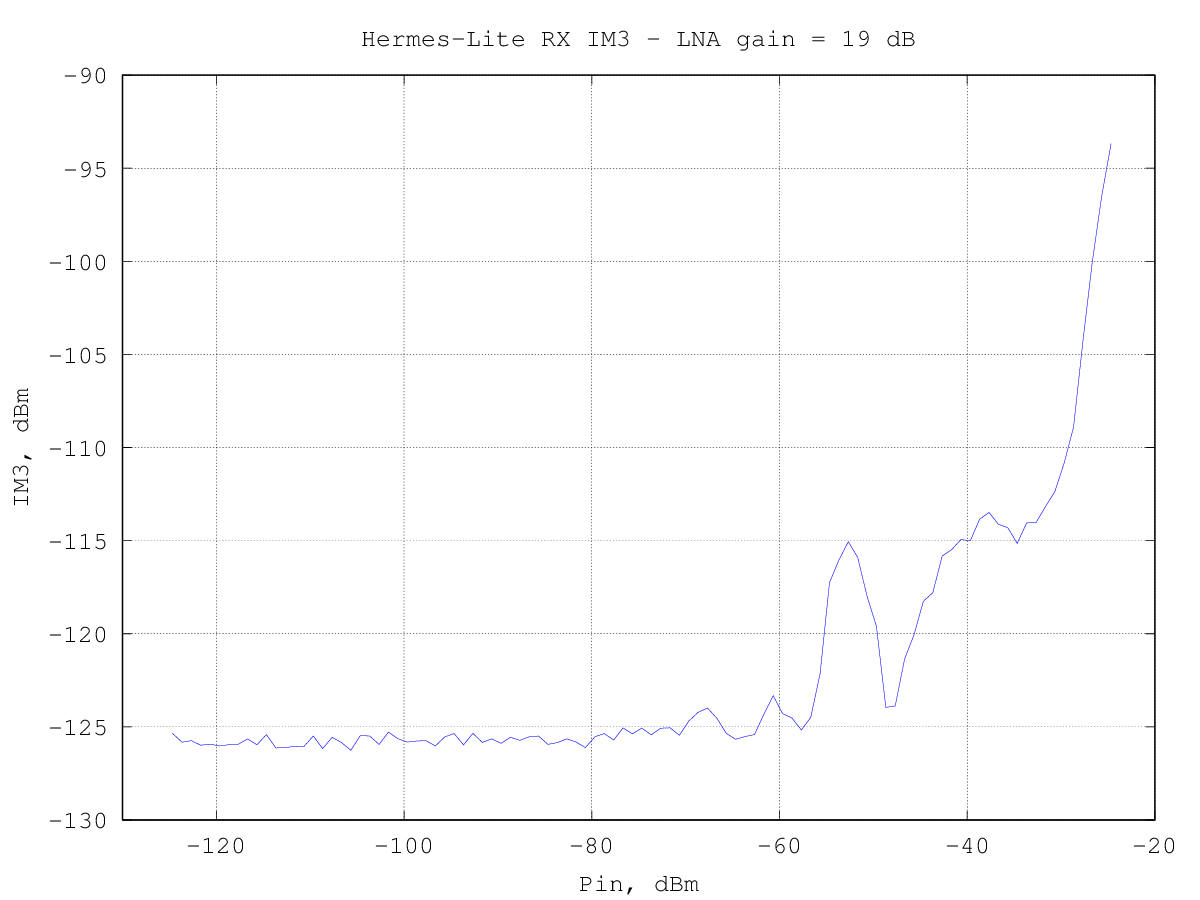
the third-order intermodulation products start to rise slightly above the noise floor (about -126 dBm) for an input power of about -70 dBm per tone.
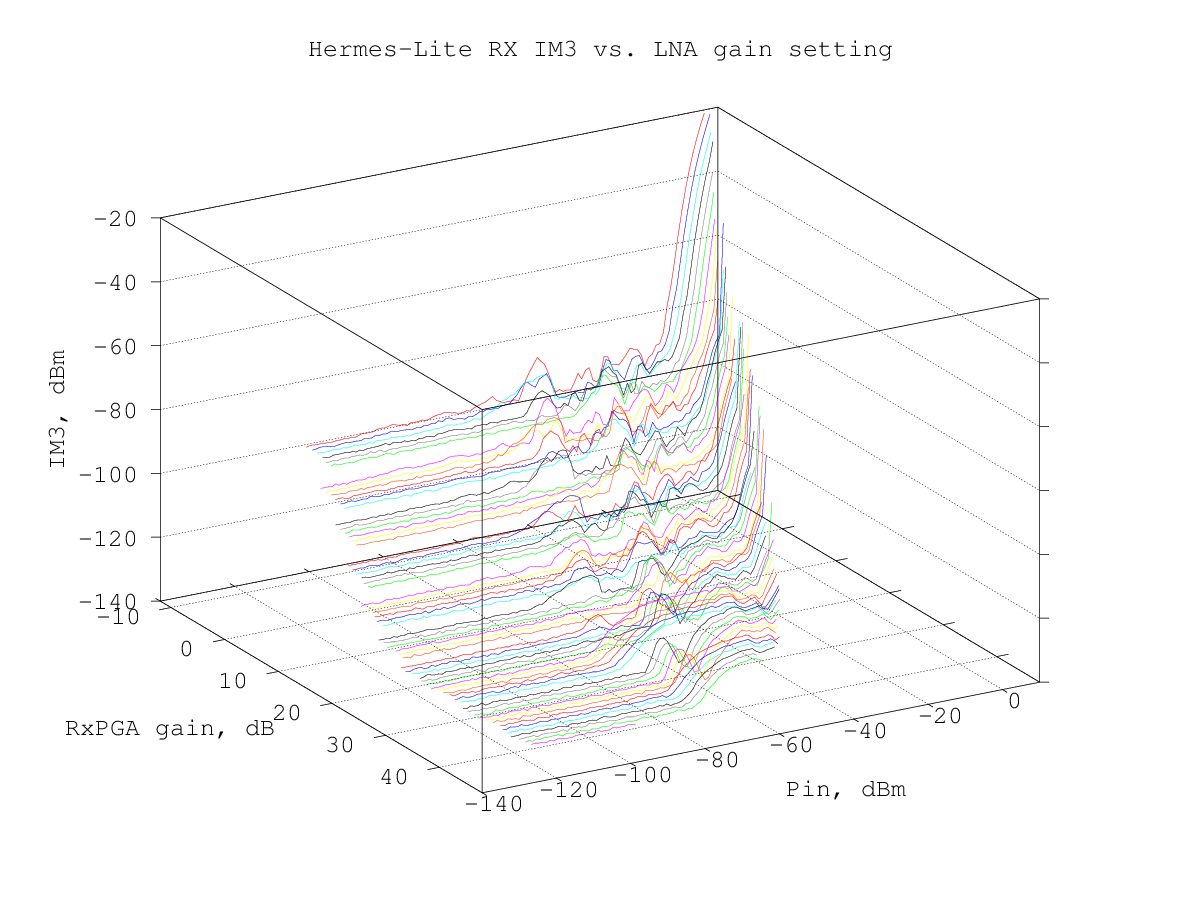
Note that for a direct-sampling RX as the Hermes-Lite the intermodulation behavior is different from the classic analog receivers, in that the intermodulation products level does not follow a power-law, that is, in the graph above the IM3 level is not a straight line with a slope of +3.
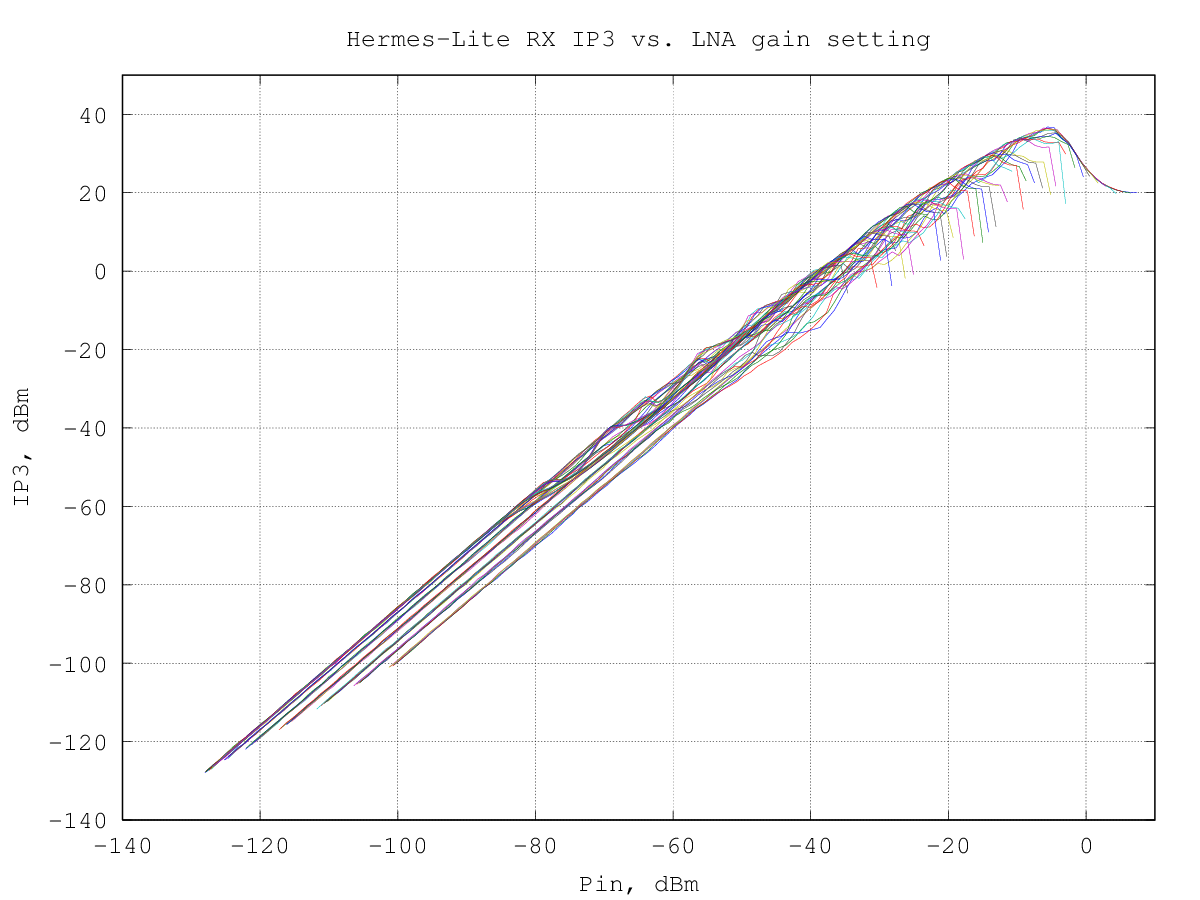
The same data above can be translated into an equivalent third-order intercept point:
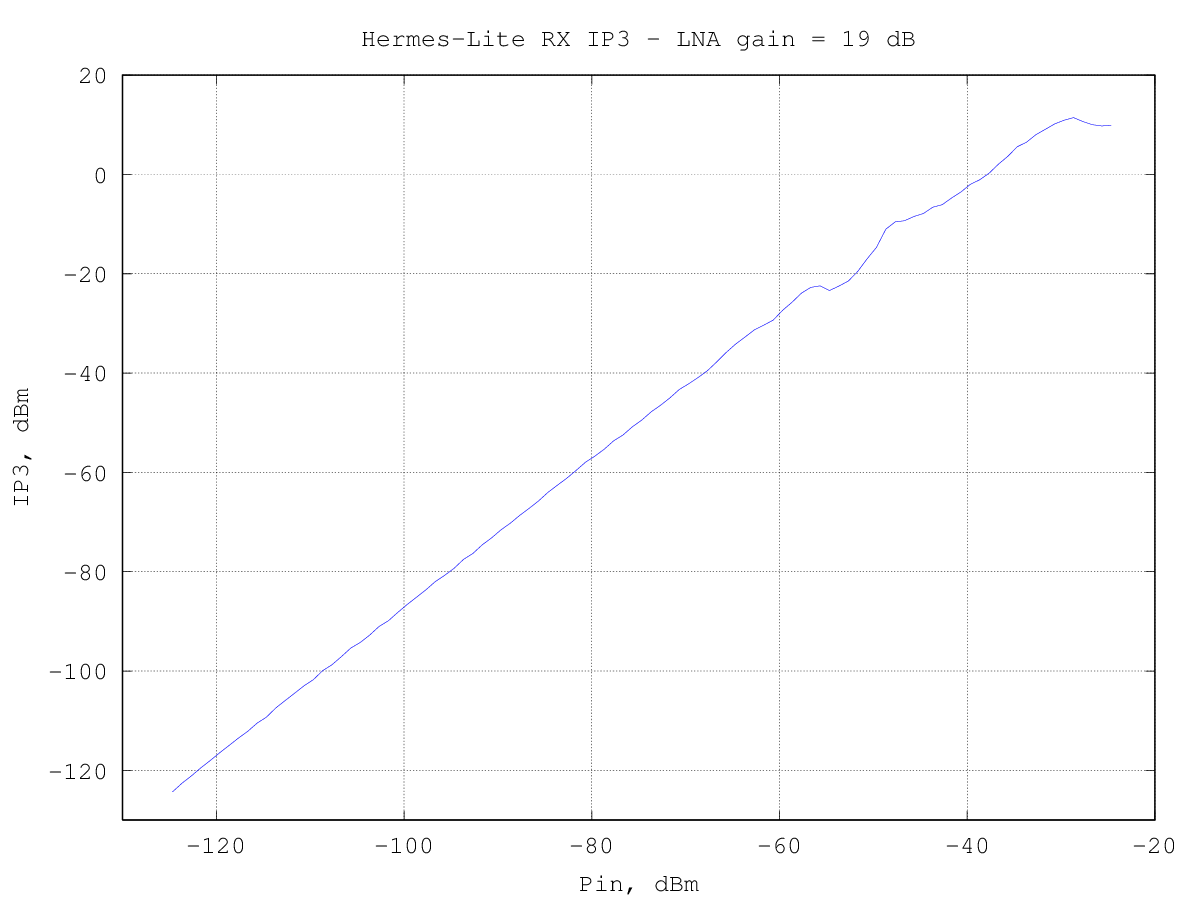
the curve is actually valid starting from an input power of -70 dBm per tone, where the intermodulation products start to rise above the noise floor. As it can be seen, the RX IP3 strongly depends on the input signal level and starts at about -40 dBm to reach a peak of about 10 dBm shortly before saturating the ADC.
The third-order intermodulation products levels were measured for all the RxPGA gain steps; the overall result is shown in the graph below:
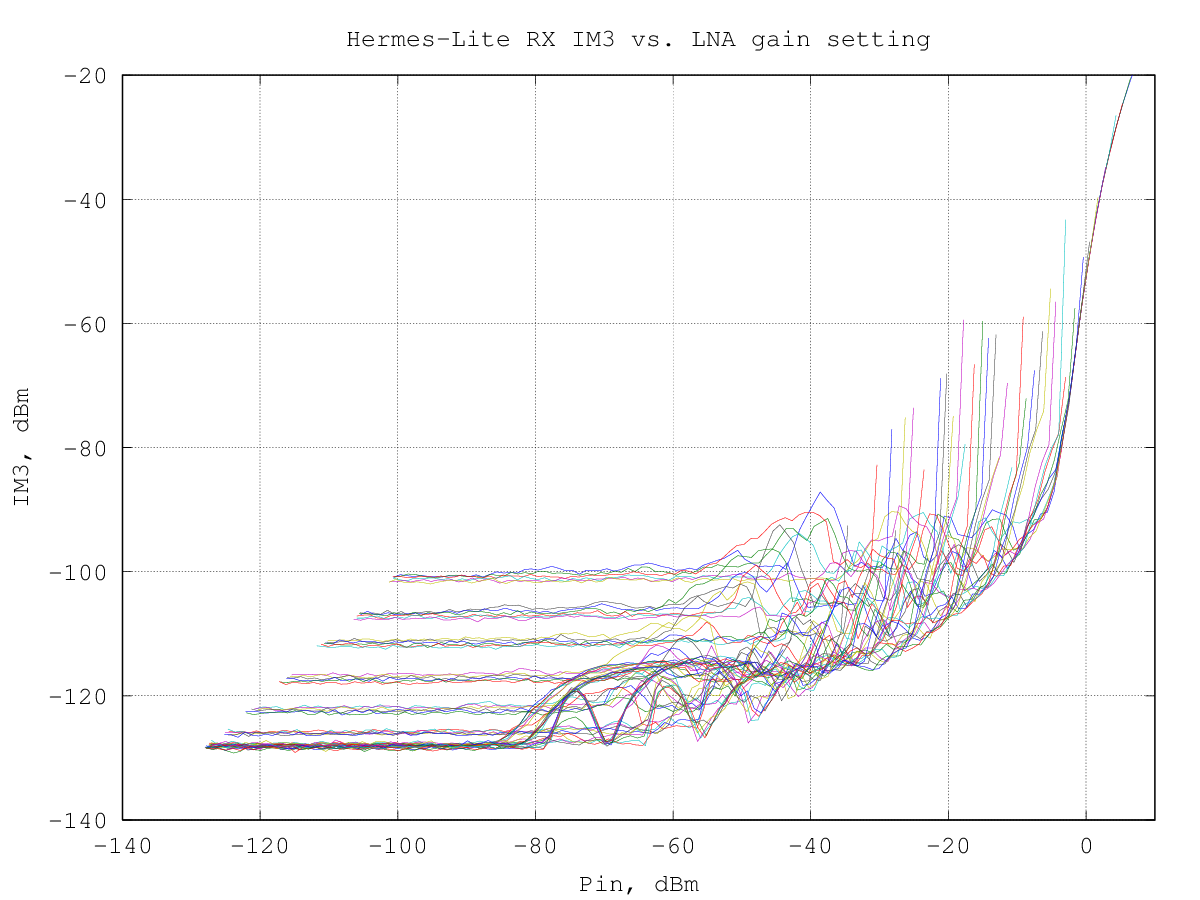
here is a view of the same data using a 3D graph, which may help to check the shape of the IM3 products curves:
the same data, expressed as (equivalent) intercept point:
Second-order intermodulation
Second-order intermodulation measurements done with two input tones of equal power and frequencies 8.1 MHz and 6.1 MHz; the intermodulation product measured is at the sum frequency of 14.2 MHz.
The input tones power was swept from a value equal to the noise floor at the selected gain setting up to the ADC saturation point.
In all the following graphs the input power is per tone.
The following graph shows the measured level of the second-order intermodulation products with the RxPGA gain set to 19 dB:
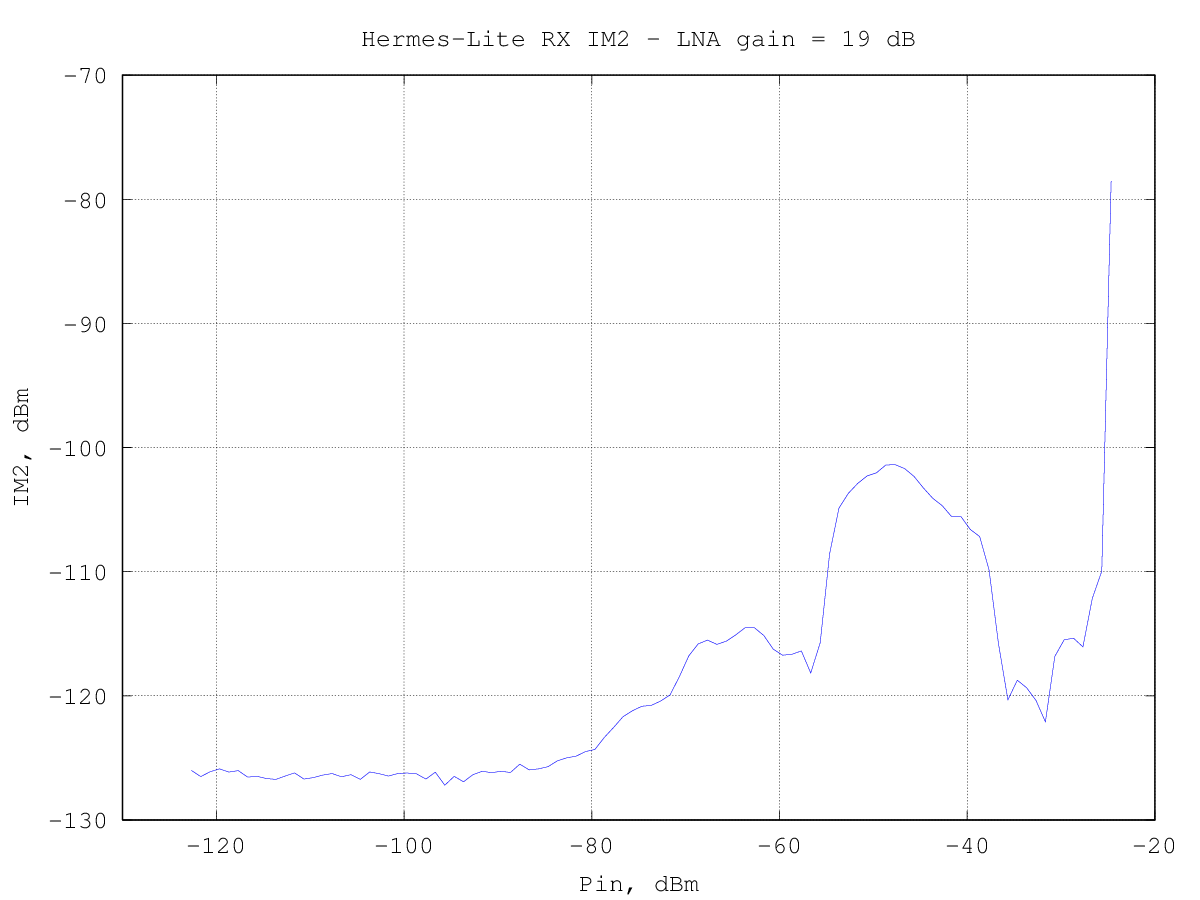
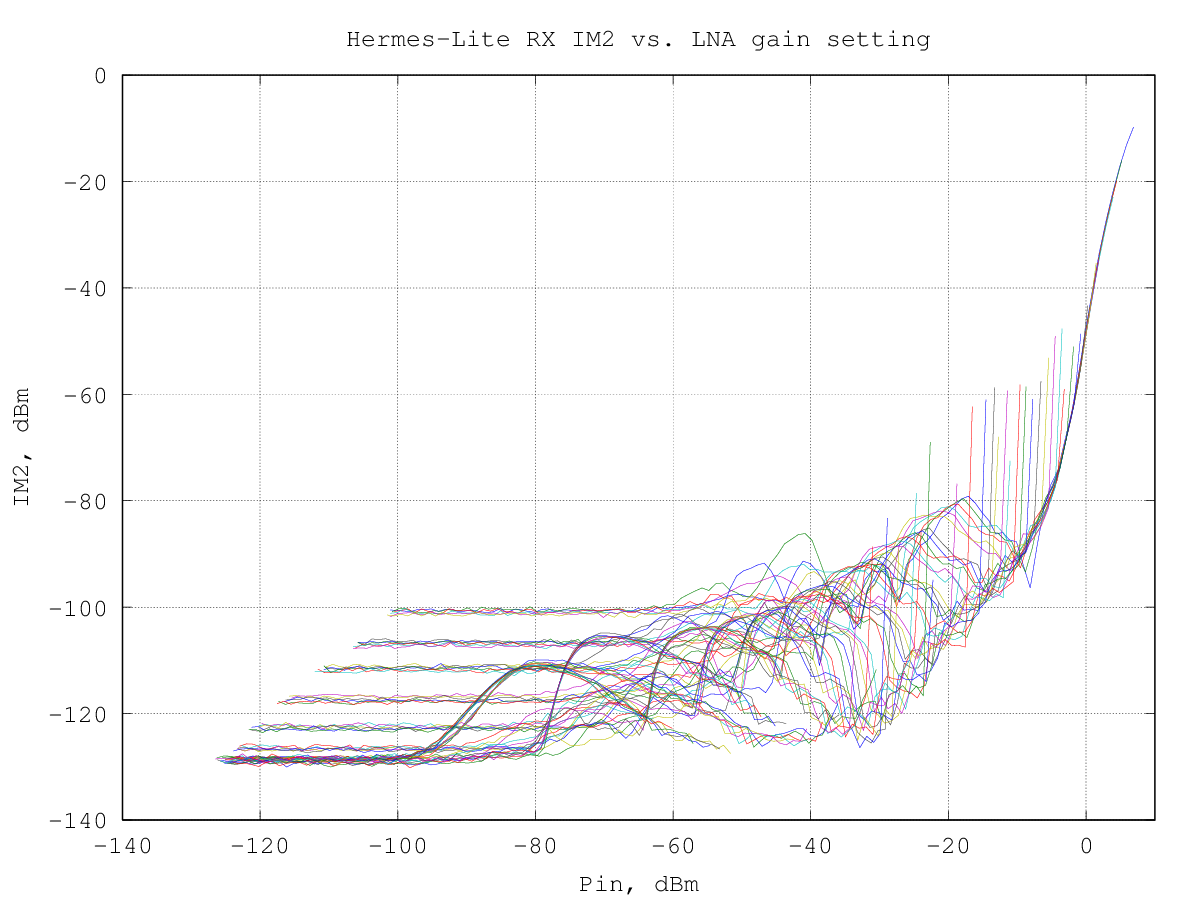
the second-order intermodulation products start to rise slightly above the noise floor (about -126 dBm) for an input power of about -70 dBm per tone.
as seen for the third-order intermodulation products, the intermodulation behavior is different from the classic analog receivers: the intermodulation products level does not follow a power-law, that is, in the graph above the IM2 level is not a straight line with a slope of +2.
The same data above can be translated into an equivalent second-order intercept point:
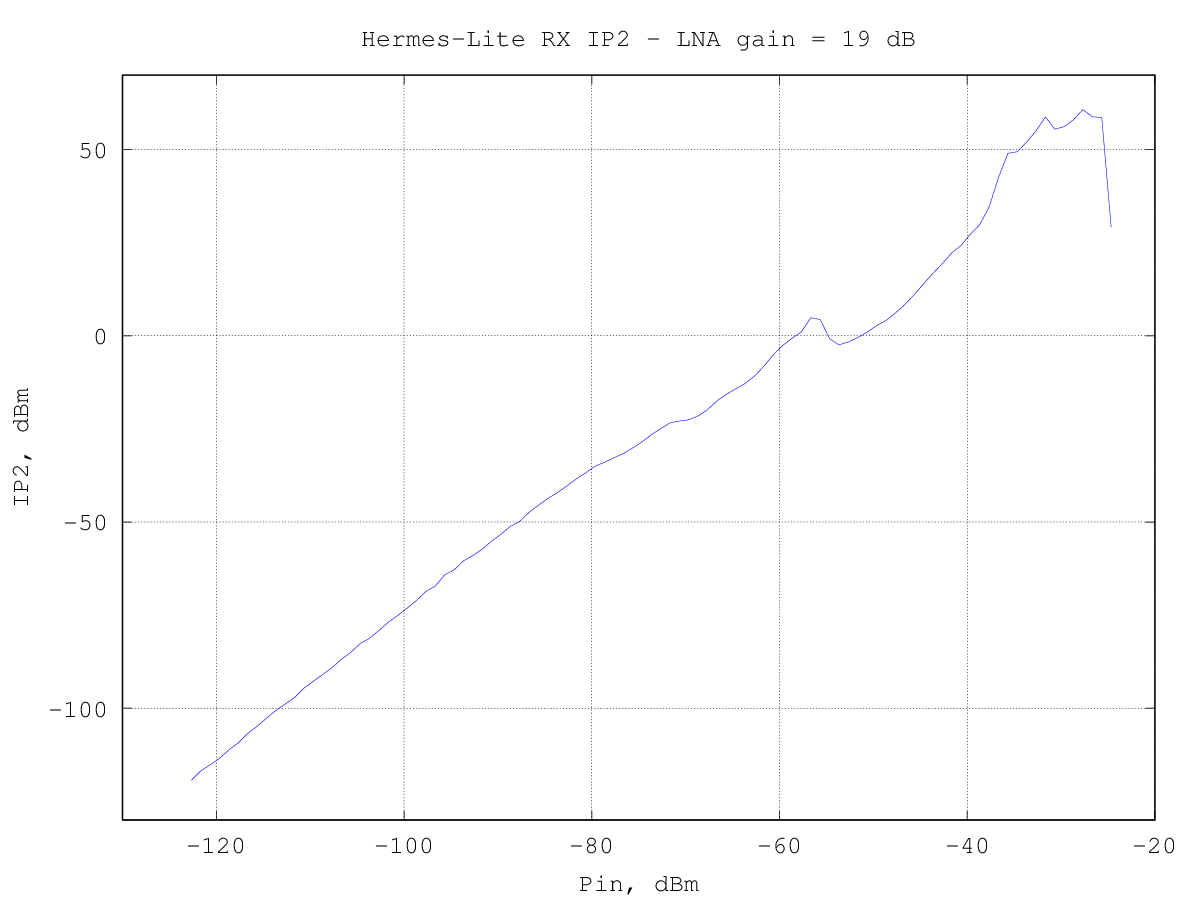
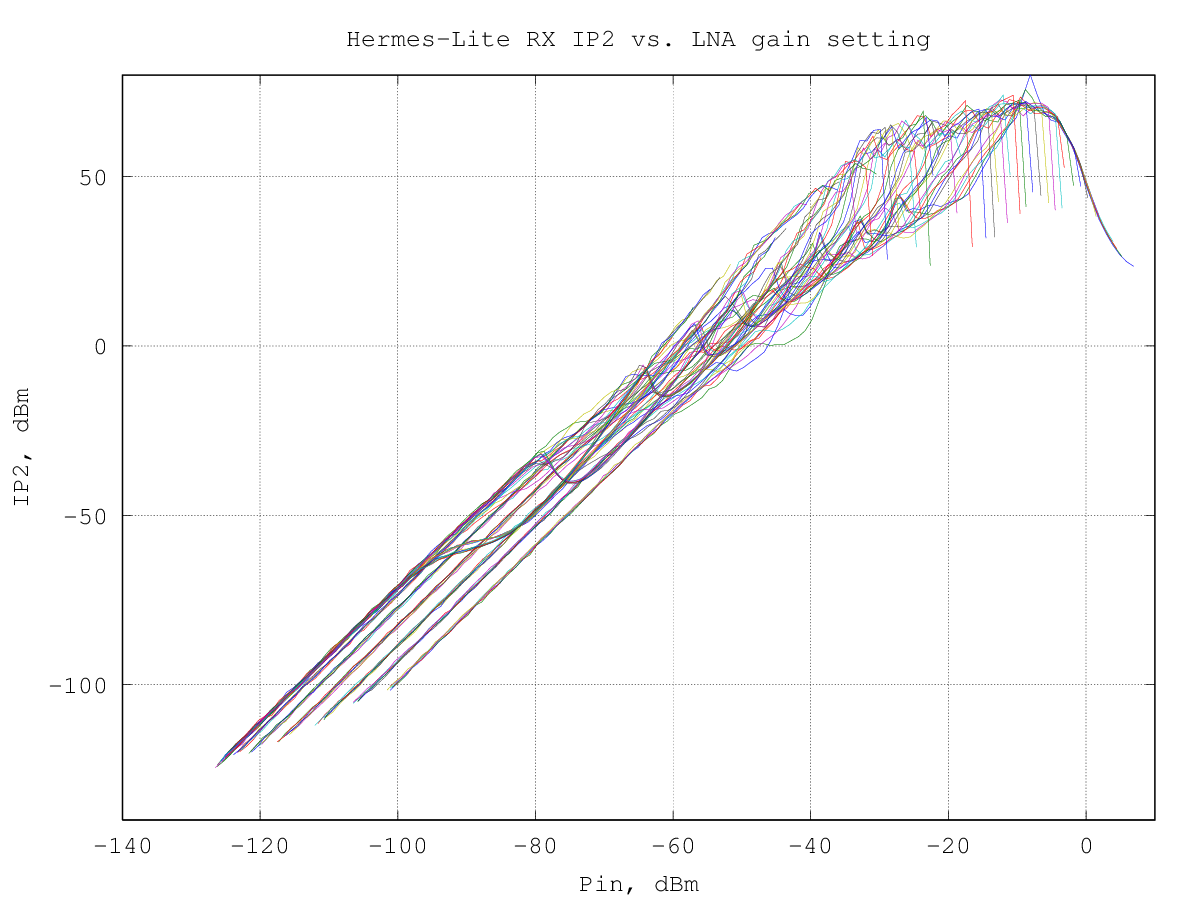
the curve is actually valid starting from an input power of -70 dBm per tone, where the intermodulation products start to rise above the noise floor. As expected, the RX IP2 strongly depends on the input signal level and starts at about -20 dBm to reach a peak of about 60 dBm shortly before saturating the ADC.
The second-order intermodulation products levels were measured for all the RxPGA gain steps; the overall result is shown in the graph below:
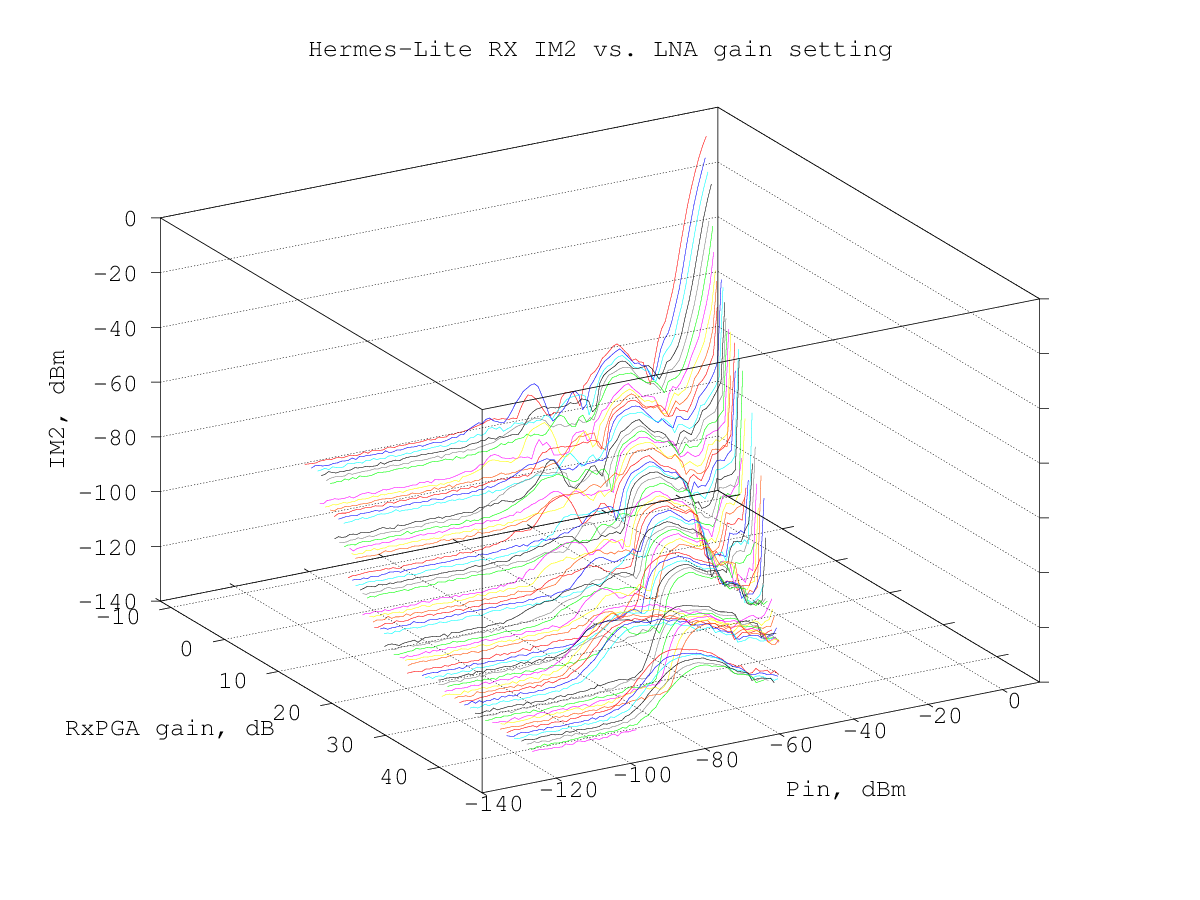
here is a view of the same data using a 3D graph, which may help to check the shape of the IM2 products curves:
the same data, expressed as (equivalent) intercept point:
Incidental dithering and second-order intermodulation
There are sometimes discussions about how a direct-sampling RX can (appear to) perform so well in practice when the lab measurements show that it generates second- and third-order products (and higher orders too) even at low input power levels or, at least, at power levels where a classic "analog" RXs usually does not generate significant intermodulation levels.
Trying to find a plausible explanation I have measured the IMD2 of my Hermes-Lite when, in addition to the two test tones, also additional noise was presented to the ADC. The test signals were at 6.1 MHz and 8.1 MHz and the IM2 product measured was the sum frequency at 14.2 MHz; the noise added came from my vertical antenna, where the signals in the 20 meter band were removed using a notch filter to avoid masking the intermodulation product.
Here is a drawing of the measurement setup:
                   _________      _________
generator_1 o-----|         |    |         |
                  |         |    | 10 MHz  |
                  |combiner |----| lowpass |----.
                  |         |    | filter  |    |     _________
generator_2 o-----|_________|    |_________|    '----|         |
                                                     |         |
                                                     |combiner |----o to Hermes-Lite input
                   _________                         |         |
                  | 20 m    |    .-------------------|_________|
                  | band    |    |
    antenna o-----| notch   |----'
                  | filter  |
                  |_________|
The intermodulation product was measured in the evening, when strong signals are present in the lower bands, in the morning, with lower low-bands signals levels and also without any external noise added, connecting a dummy load instead of the antenna. The results were quite interesting:
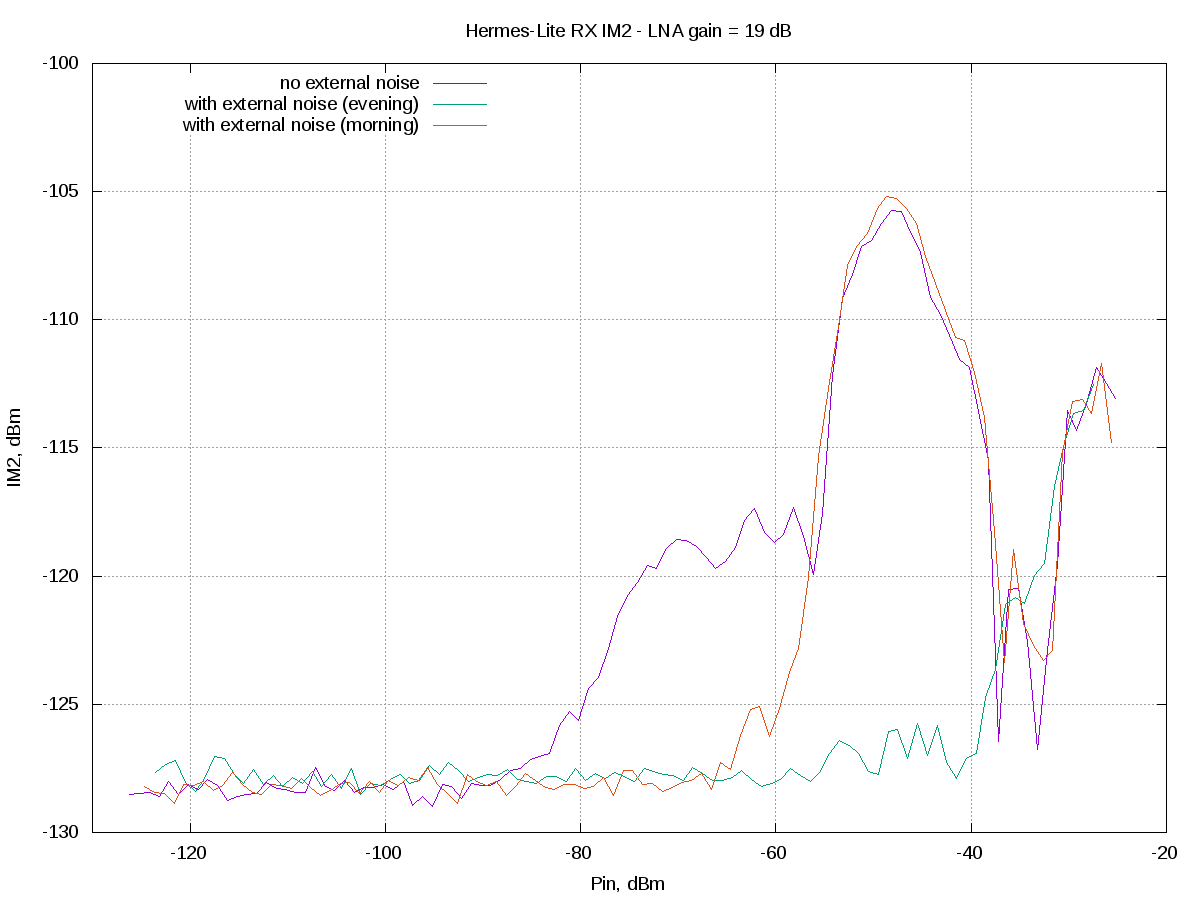
I appears that when additional strong signals are present, the intermodulation signal is reduced significantly in amplitude, likely spread over a larger band by what Adam, VA7OJ, defined "incidental dithering".
half- vs full-duplex intermodulation
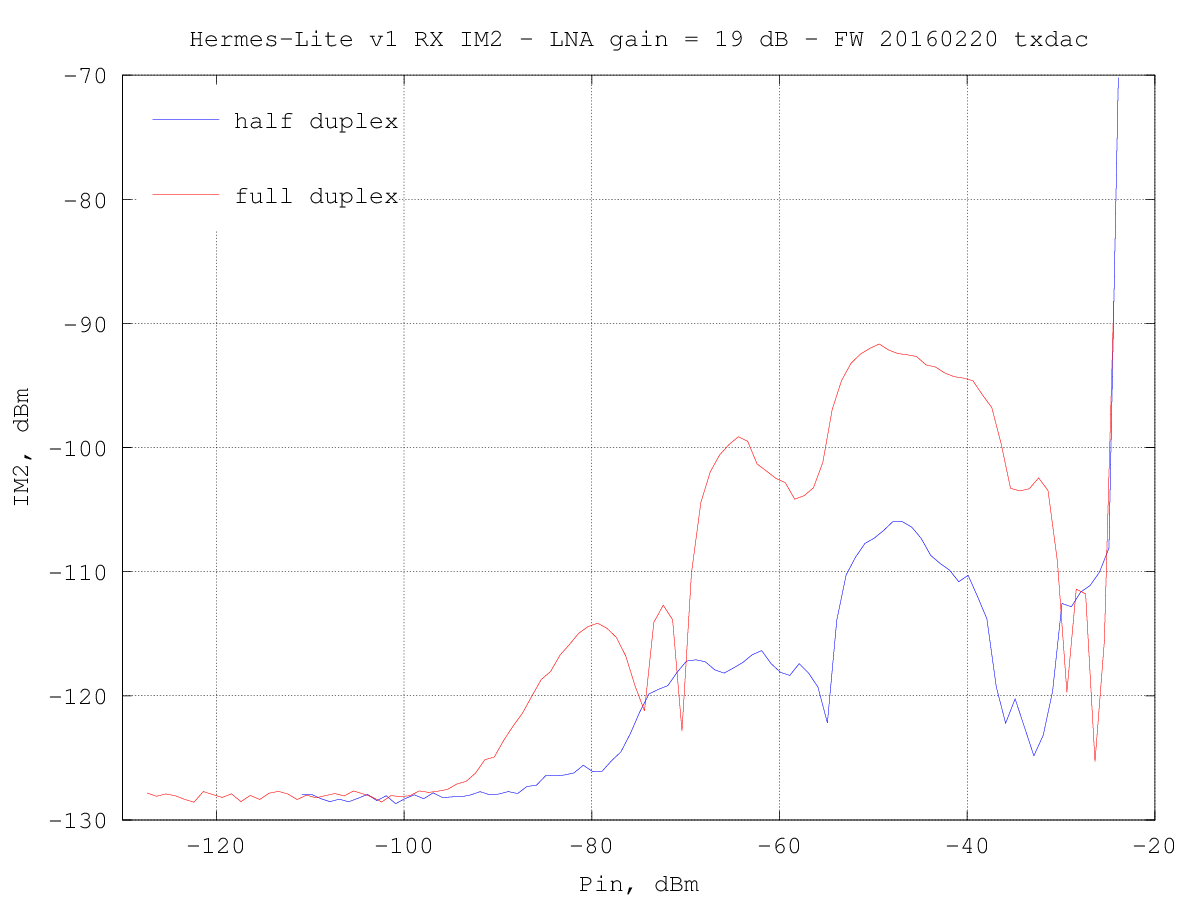
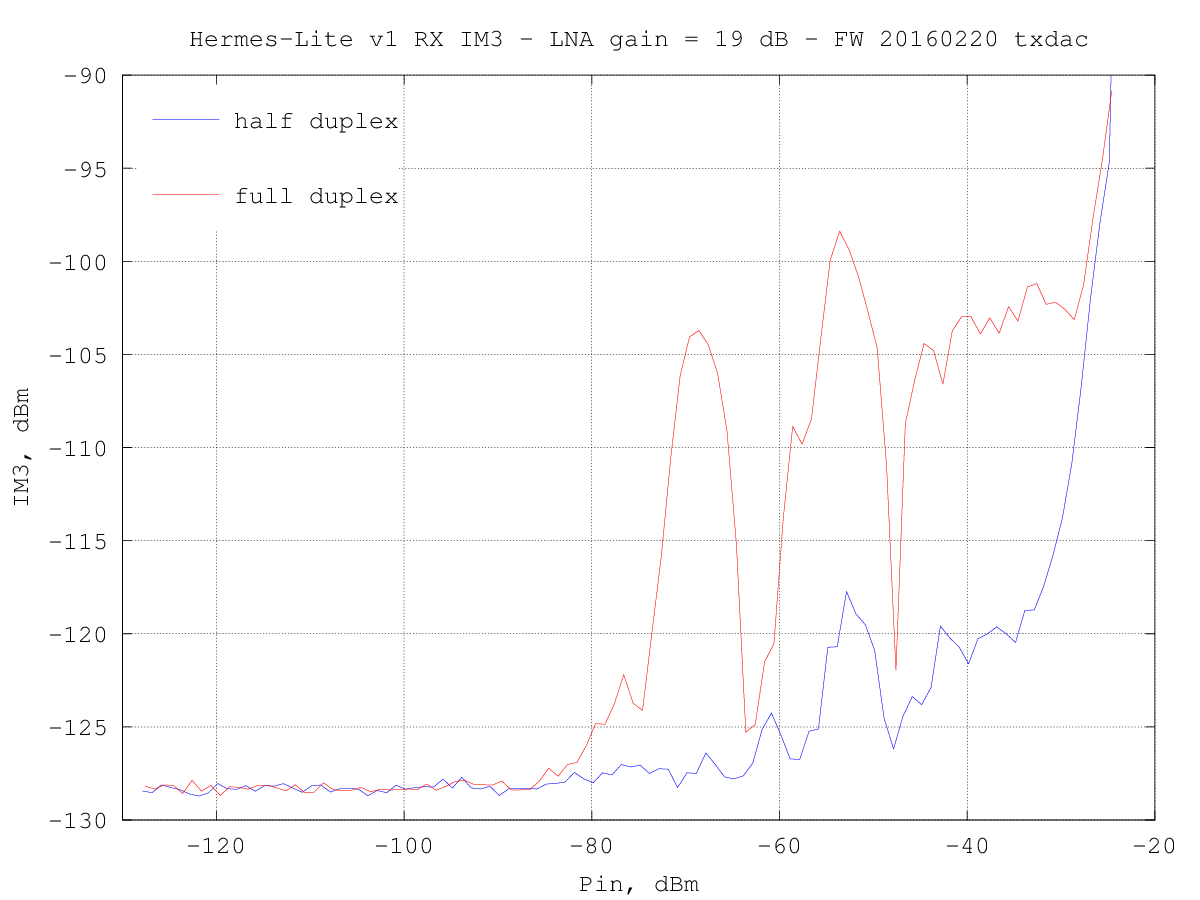
While doing measurements of the Hermes-Lite v2.0 performance, a significant difference in the intermodulation products was seen - the H-Lv1 being quite better than the v2. After some experiments, it was clear that one of the main reasons was that on the v1 the intermodulation measurements were done using the half-duplex mode, where all the TX circuitry inside the AD9866 was not active during RX. The v2 used the full-duplex mode as default, so there was more digital activity in the device during RX.
To check the effect of the full-duplex setting on the v1, new measurements were done on its RX using this mode: the results show clearly that, when using the full-duplex mode, the v1 was actually quite worse:
