
 Live HF Propagation Maps and Charts
|
Regional Propagation Maps
based on ham activity and ionosondes. Pros: Shows geographical distribution Cons: No explicit signal disruptions
Recent Ham Activity (160—6 m)
 Recent MUF Map (ionosondes)  Live LUF map calculated by D-Rap model 24-hour HF Planner point-to-point QSO |
Global Conditions Charts based on solar-terrestrial data. Pros: Signal disruption indicators Cons: No geographical distribution Recent R-S-G reports  More Space weather reports Recent solar flares |
One of the best tools to forecast HF (high-frequency) propagation is the online map shown below.
It is a graphical representation of MUF within a 3000-kilometer range, allowing amateur radio station operators to estimate the best frequencies and paths for effective communication.
2. Limitations of this map
3. Animated map
See other useful charts of HF propagation today.
Ionospheric regional conditions
HF propagation prediction tools
Choosing the right HF frequency
Real time radio propagation map
The art of HF Frequency Selection
HF propagation seasonal anomaly
Current ham radio HF propagation
HF propagation status and alerts
Current solar conditions Ham radio
HF Radio Propagation Search Terms
HF propagation for hams explained
How to read propagation charts
Understanding propagation charts
How to read propagation charts for HF
How to read propagation charts for HF DXing
Radio propagation for hams explained
Disrupted HF propagation conditions
Radio propagation seasonal anomaly
Skywave propagation seasonal anomaly
Current HF Band Conditions Online Map
Skywave propagation for hams explained
Current Ham Radio Propagation Conditions
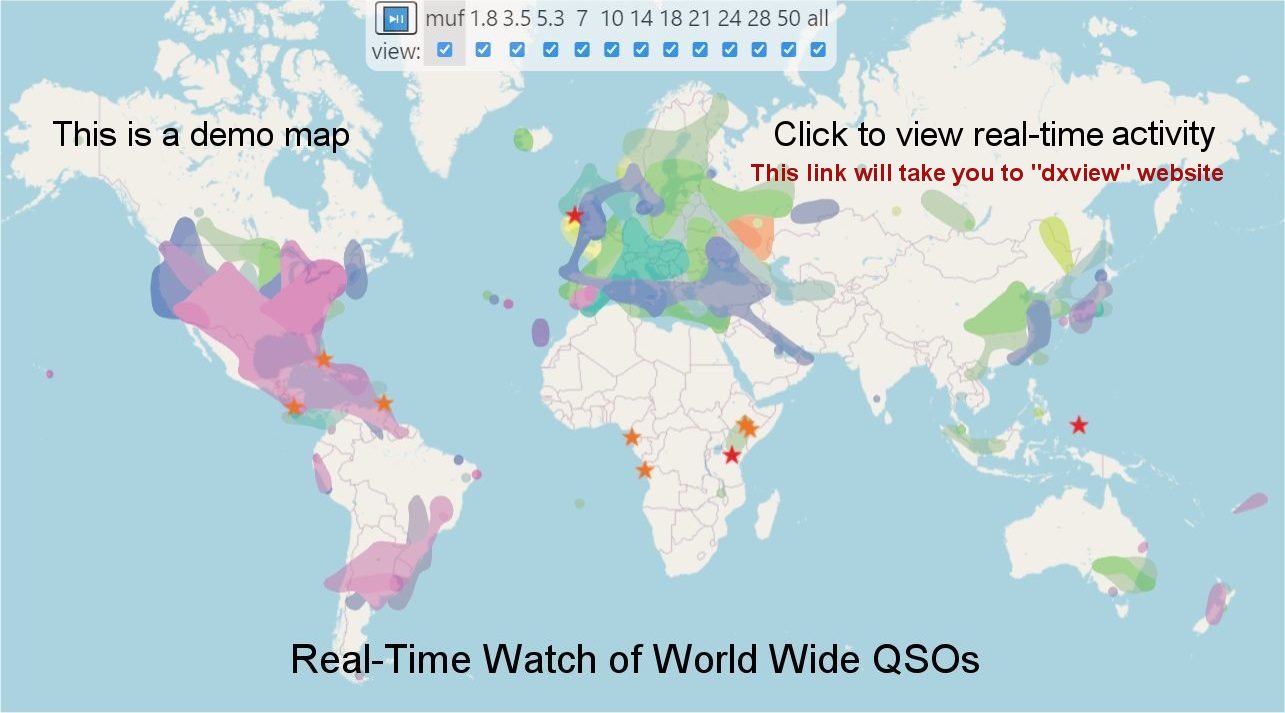
Real-time watching of worldwide ham activity
How does the sun affect radio communication?
Real-time watching of worldwide activity of hams
The Fascinating World of HF Skywave Propagation
What is the Best Frequency for HF? FOT, OTF, OWF
Current HF Bands Conditions—Charts for Radio Hams
Current HF Band Conditions Maps For Radio Operators
HF propagation Global Conditions Charts
HF propagation Regional Propagation Maps
Global Conditions Charts of HF propagation
Regional Propagation Maps of HF propagation
Propagation of radio waves explained
24-hour forecast for point-to-point communication circuit