
 HF Propagation Condition Map
A useful guide for amateur radio operators
|
Recent R-S-G reports Radiation-S.Protons-Geomag activity  Recent solar flares | Space weather reports |

Overview:
To make the most of HF band conditions maps, it's essential to have a basic understanding of the factors that influence HF radio propagation. These factors include: Solar Activity, Geomagnetic Conditions, ionospheric storms, daily variations caused by sunrise and sunset. By understanding these factors, operators can optimize their radio communications, tune in to distant stations, and make informed decisions about band selection and antenna configurations.
Practical Online Maps:
- DXView: Real-Time Map of World-wide Ham Activity on HF Bands designed by Jon Harder, NG0E:
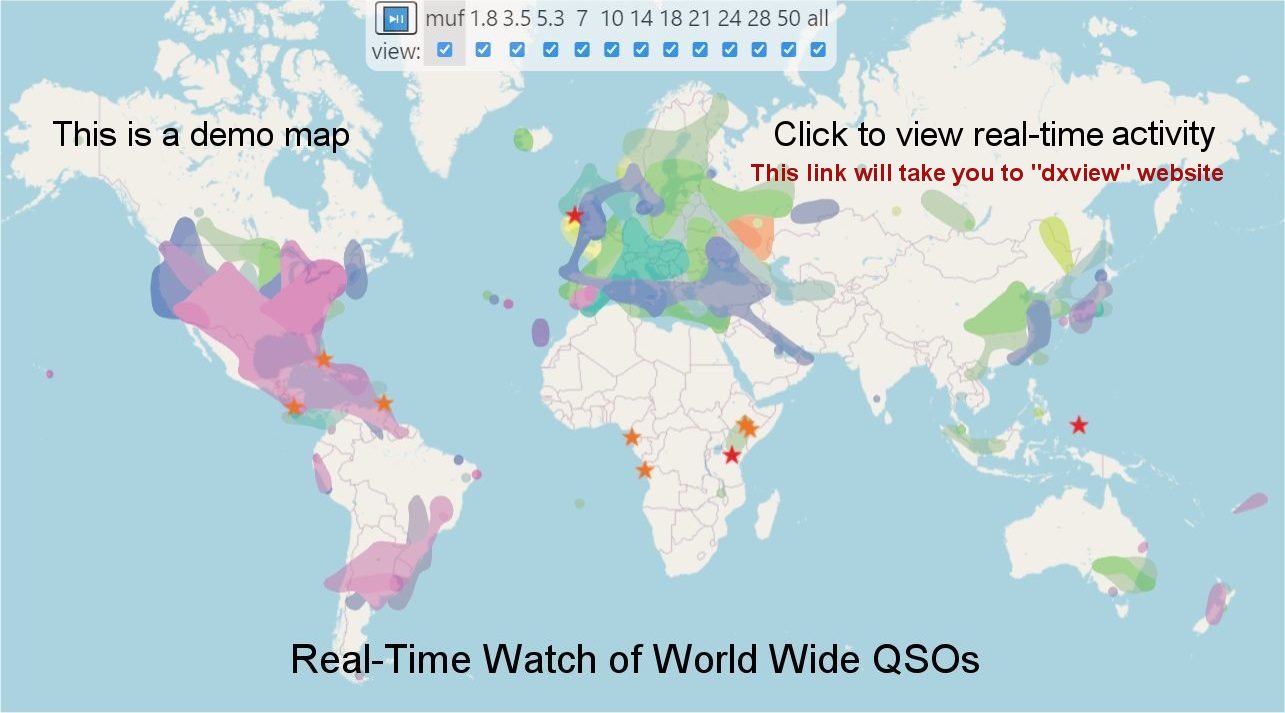
First click on the above map; then you may click on "Perspective" filling in your QTH location.
JavaScript is required to view the graphics.- This map shows the last 15 minutes' worth of real-time global radio activity from amateur stations on 11 bands (1.8-54 MHz). It uses data from WSPRnet, Reverse Beacon Network, PskReporter, and DX Cluster to update once every minute.
- MUF (Maximum Usable Frequency) is the highest frequency that allows for two-way communication. Given that the display is based on real-time data, MUF can be considered the highest frequency used on this map.
- Data for the map is gathered from WSPRnet, Reverse Beacon Network (CW, FT4, FT8), and DX Cluster, among other online resources: WSPRnet, Reverse Beacon Network (RBN) ↗, and DX Cluster. Some of these sources offer information on the signal-to-noise ratio (SNR) levels.
- The SNR can be used to determine whether a specific path supports particular modes, such as single sideband (SSB) or morse code (CW).
- The map indicates SNR levels (dB) with three different shades: SSB (SNR > 10), CW (SNR > -1), or digital modes (which can decode down to an SNR of about -28).
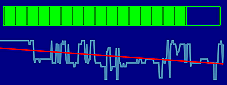
- The MUF3000 current map shows the status of HF propagation in the past 15 minutes:
- Interpretation of Maps: Some HF Band Conditions maps display important parameters such as MUF (Maximum Usable Frequency), foF2 (critical frequency of the F2 region), and signal to noise ratio. Understanding these parameters will help you assess the current propagation conditions and predict the best bands for communication. Learn about these topics here
- Monitoring Propagation: Regularly checking HF Band Conditions maps allows you to monitor real-time changes in propagation conditions. Consider combining the information from maps with observations from varioud resources such as:
- Ionospheric Map ASWFC
- Global Ionosphere Radio Observatory GIRO
- Mirrion 2 - Real Time Ionosonde Data Mirror NOAA
- Real-time foF2 - Plots for Today, Yesterday and the past 5 days (more than 100 links to Inonosonde stations)NOAA
- Ionogram Information Serge Stroobandt, ON4AA
Conclusion:
HF band conditions maps provide insights into HF radio propagation conditions for radio operators and enthusiasts. Operators can enhance their communication and explore the fascinating world of long-distance radio transmission by staying informed about current and predicted propagation conditions. Stay updated by regularly checking reputable websites such as the Space Weather Prediction Center (SWPC) and combine the map information with other available resources to make the most of your HF radio experience.
See HF propagation today.
and the QRZ site since August 17, 2022,
sorted by visitors marked with their flags.
Repeat visits counted as new after 24 hours.