What is the T Index?
The T Index Explained
Introduction ►
Ionosphere ► MUF concept ► Ionosondes ► The solar cycle
► Global vs regional conditions ► T index concept ► T index current map
►Summary: The T index is "equivalent sunspot number"
► Global vs regional conditions ► T index concept ► T index current map
►Summary: The T index is "equivalent sunspot number"
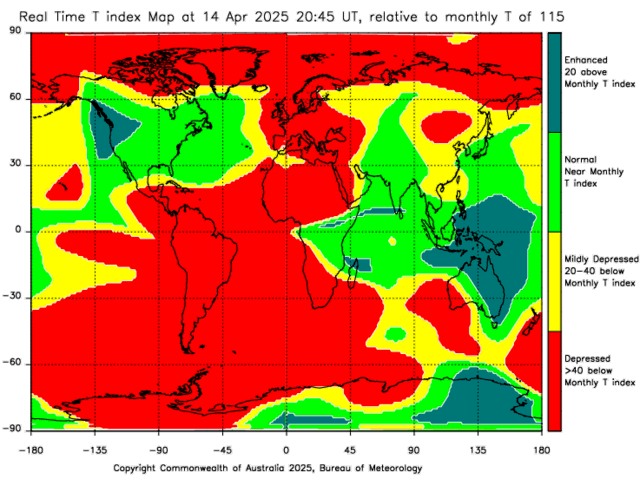
- The T index quantifies the HF propagation conditions at a certain point on Earth compared to the global average conditions. Before explaining the T index in detail, it is worth explaining some basic concepts. If you are familiar with the concepts of ionosphere, MUF, sunspots, and solar cycle, you may proceed here.
- The solar radiation generates the ionosphere. See Figure 1:
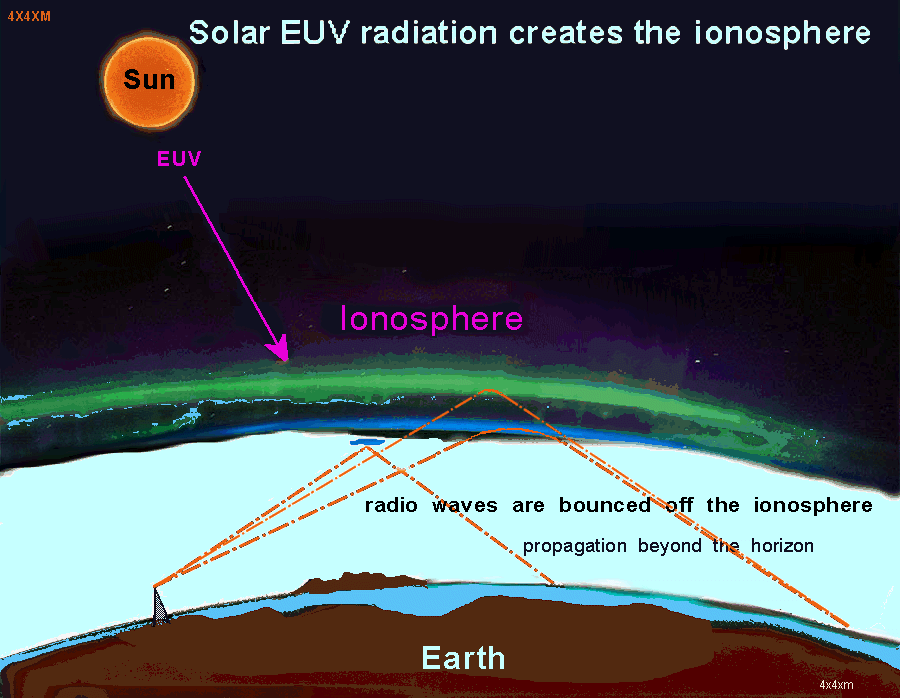
Figure 1: The ionosphere - The MUF: For any HF communication circuit, there is a Maximum Usable Frequency (MUF) refracted back to Earth by the ionosphere. The MUF varies with the angle of transmission, time of day, seasons, and solar cycle.
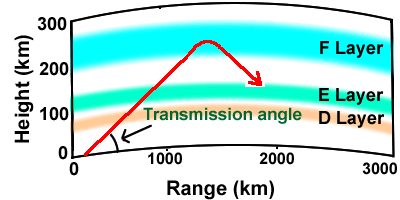
Figure 2: Angle of transmission
Figure 3: Ionospheric regions during day and night
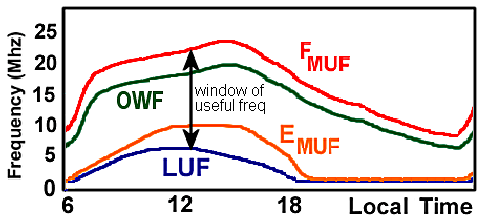
Figure 4: MUF change along the time of day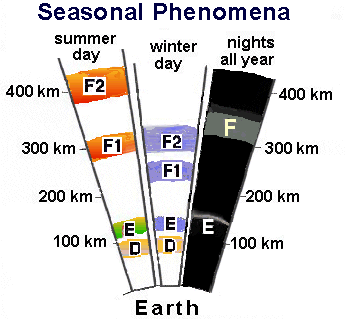
Figure 5: Daily and seasonal variation at mid-latitudes - The MUFs are measured by an instrument called an ionosonde. An ionosonde transmits a vertical signal and records all reflections—it is basically a radar for scanning the ionosphere.
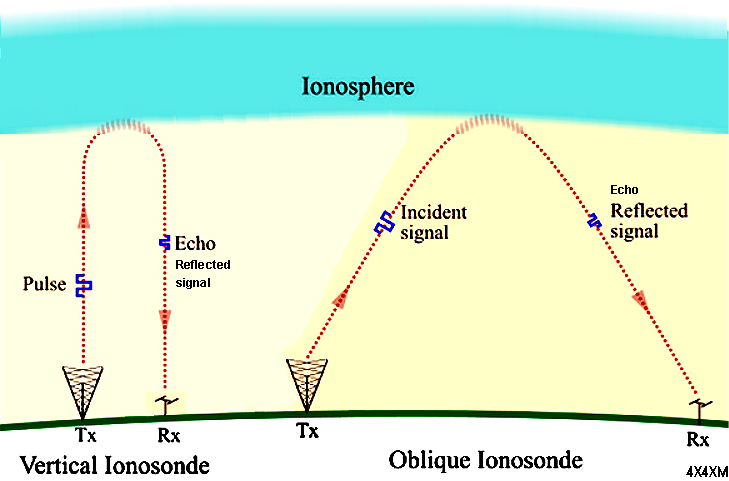
Figure 6: Ionosonde - The conventional index of the solar cycle is known as the sunspot number, as observed by optical telescopes. The sunspot nymber can be defined on a daily basis but is more normally averaged over a month or a year. The yearly average is mostly used as an indicator of the progress of the solar cycle.

Figure 7: The solar cycleAt the peak of the solar cycle, the ionosphere reflects higher frequencies, allowing HF communications to utilize a broader bandwidth. Conversely, during the low points of the solar cycle, only a limited bandwidth is available. The solar cycle varies over a period of typically 10 to 11 years from trough to peak and then back to another low point.
- On a global scale MUF is correlated with the sunspot number. But regional conditions in the ionosphere are affected by more than just the factors giving rise to the sunspot number—for example, geomagnetic storms can change the ability of the ionosphere to reflect signals back to Earth. Also, the solar EUV radiation, which actually produces the ionosphere, does not always vary in exact accord with the sunspot number.
- The solution is to use an ionospheric index such as the T index. This index is derived from observed values of maximum ionospheric frequencies and has the same scale as sunspot number. To derive an ionospheric index system such as the T index, it is necessary to make extensive observations of the ionosphere over several solar cycles and to then plot the maximum ionospheric frequency against the sunspot number. From this, it is possible to obtain a relationship between frequency and sunspot number. Then, given some recent observations of MUFs, the relationship can be used to derive a value of the equivalent sunspot number—this is the T index, and it will generally be slightly different from the real sunspot number. That is essentially the way that T indices are derived, although there are complications because it is necessary to repeat the process for each time of the day and for each month of the year. Also, each point on Earth is different, and you need to produce maps.
- The T index can be best regarded as an "equivalent sunspot number"—the sunspot number that would best match the observations made by ionosondes. IPS has a network of ionosondes located in the Australasian region and can derive the most appropriate T index. This can then be used by IPS customers to get the best results for their HF communications. The T index can take on any value but is usually restricted to the range -50 to 200. Low T index values imply use of the lower HF frequencies, such as around solar minimum or during a severe ionospheric storm. Higher T indices and therefore higher frequencies will usually be the norm near solar maximum.