10c.1 Understand the purpose and basic operation of an oscilloscope.
Calculate the frequency and voltage of a waveform from given data.
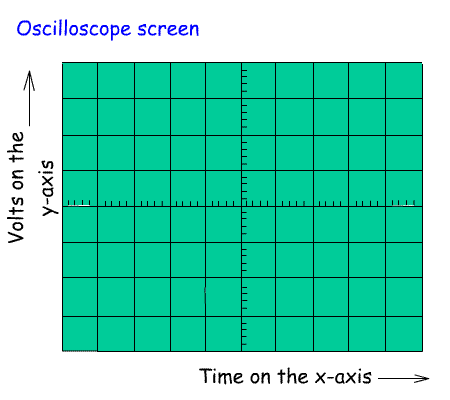
The purpose of an oscilloscope
is to show voltage (on the y axis) against time (on the x axis). This
means that it is possible to see the shape of a wave or a line on the
screen. The screen is normally divided into squares which enable
someone to measure the voltage in conjunction with the settings.
Operation of an oscilloscope
- Turn on the oscilloscope
- Set the volts per centimetre to 2. This means that on the screen each 1cm square represents 2 volts.
- Set the time per centimetre to 0.1. This means that the beam will sweep across the screen in 0.1 x 10 = 1 second.
- Set the trigger to auto. This means that each wave will start at the leftmost edge of the screen
- You should now see a green beam move across the screen from
left to right. use the focus control to sharpen this up and the
intensity control so that you can see the beam clearly, but it should
not be so bright that it burns the screen!
- If you cannot see the beam, use the y shift control to
bring the beam onto the screen and set it so the beam is on the centre,
calibrated line. This is set at zero volts.
- Plug an input lead into the CH1 socket. Some oscilloscopes have two channels labeled CH1 and CH2. Others only have one channel.
- Connect
a 6 Volt or similar battery to the input. The line should move up to
the position shown in the drawing.Remember each 1cm square is 2 volts,
so 3 squares = 3x2=6V.
- Reverse the battery leads and the line should move to 3cm below the centre line. This is -6V
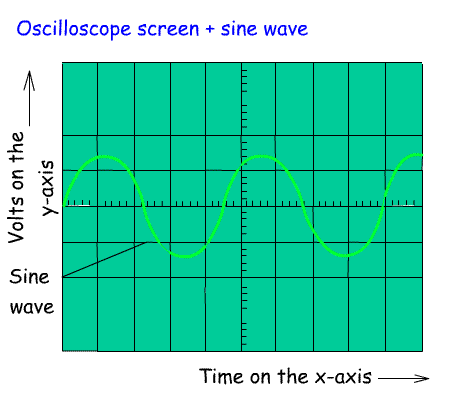
- Disconnect the battery and attach a signal generator to the input leads.
Adjust the frequency and output level of the signal generator until you
can see a sine wave on the screen. This shows how the voltage of the
sine wave varies with time. The sine wave has an amplitude of + or - 2.4 Volts.
The time for one wave is 0.45 seconds. Remember we set the x-axis to
0.1V per cm. As one full wave takes 4.5 cm of screen this is equal to
4.5 x 0.1 = 0.45 seconds.To calculate the frequency of this wave:
f=1/T
f=1/0.45
f=2.2 Hz
- This
is just the start of what you can do with an
oscilloscope. One or two points to watch - The probes often have an
attenuator built into them. There is a switch on the probe that is
labeled x10. If you use this then you need to multiple your results by
10 to achieve the correct reading.
What we have described is a basic analogue oscilloscope. With the wide
use of digital electronics the digital oscilloscope is now widely used.
These are able to store a series of pulses on a line for viewing on the screen.
The analogue oscilloscope is used to view a range of wave patterns including sine waves, square waves, saw tooth waves etc.
The analogue oscilloscope is useful for looking at the output waveform
of oscillators and transmitters. If you look at the RF from a
transmitter it should have clean sine wave. If you overdrive the
transmitter the sine wave will become distorted and this is a sure sign that the harmonic content will increase.
|
|