The main window of spectrum lab contains the most important controls and
output of the spectrum analyzer:
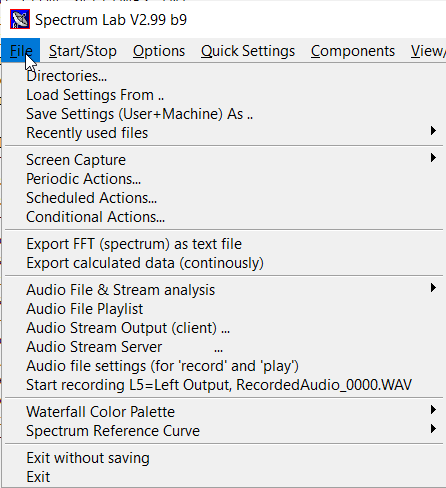
- Main Window with menu items :
- File
- Start/Stop
- Options
- Quick Settings
- Components
- View/Windows
- Help
- Built-in "Quick Settings" (in the main menu)
-
Spectrum Display (in separate document, with
frequency scale,
waterfall and/or
spectrum graph)
- Control Elements and Tabs on the main window
- Tabbed display control panel
- Frequency control tab
- Time control tab
- RDF control tab
- Readout Cursor panel
- Colour palette control (brightness, contrast)
- Progress Indicator / Stop button
- Programmable buttons
- Controls on the bottom of the main window
(spectrum buffer overview)
- The Spectrum Buffer Overwiew (in the bottom control bar)
- Navigation buttons to scroll through the spectrogram buffer
Other functions may be implemented in other windows, which you can open from
the "View" menu (in SL's main menu).
See also: Spectrum Lab's main index.
The main window contains the main menu, the spectrum
display (on the right side) and -optionally- some control elements on
the left side, and some in the control bar on
the bottom.
The main menu contains
the following items:
The 'File' menu is used to..
- load settings, change directories and select file names for screen captures, etc
- configure screen capture, periodic and scheduled actions
- Select audio files for logging and for analysis
- Select, import, export, or edit a waterfall colour palette
- Terminate the program with or without saving the (possibly modified) configuration
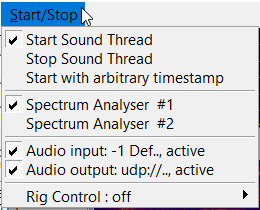
The 'Start/Stop' drop-down menu (part of the main menu)..
- starts and stops the audio processing thread,
- the spectrum analyzer,
- can temporarily disable and re-enable the audio input device
- can temporarily disable and re-enable the audio output device
- shows the state of the 'Rig Control' (on/off indicator),
with shortcuts (in a submenu) to configure and supervise it.
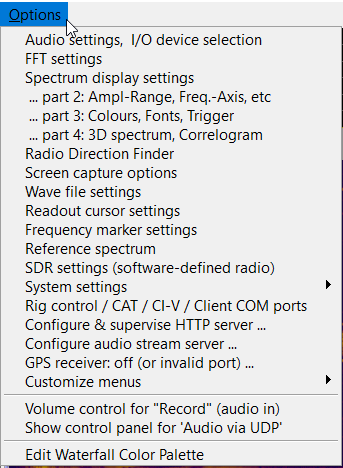
Most of the items in 'Options' drop-down menu (part of the main menu)
open Spectrum Lab's 'Configuration and Display Control' dialog,
and switch to one of the many tabsheets in that window; with...
- Audio settings, including the selection of in- and output devices,
- FFT settings (for the spectrum analyzer),
- display settings, colours, etc,
- configure the Radio Direction Finder (RDF),
- change options for saving and analyzing wave files,
- launch the soundcard's volume control program for "record" and "play",
- and many other special functions.
This menu allows to change all settings of Spectrum Lab very quickly. There
are some predefined settings in this menu, and some user-defineable entries
which are initially empty. More about creating and adding your own set of
settings can be found here.
Some of the built-in configurations in the "Quick Settings" menu
are described further below.
Configures some of the components in SL's signal analysis circuit, for example:
Input monitor, output monitor,
Test Signal Generator,
Filter Control Window,
Second Spectrogram window,
Time Domain Scope ('oscilloscope'),
Watch List and Plot window,
Command Interpreter window.
The items in this menu toggle some of the more frequently used options
in SL's main display screen. It can also be used to open some other
windows belonging to Spectrum Lab, which are not related to the
'test circuit' (unlike the 'Components' menu).
The "View/Windows" menu allows you to switch to any of these sub-windows quickly,
even if they are hidden by other windows.
Some of the sub-windows are listed here:
- toggle the spectrogram (waterfall) display on/off;
- toggle the spectrum graph (curve display) on/off;
- toggle the amplitude bar;
- toggle the correlogram;
- show/hide the controls on the left side of the main window;
- show/hide the controls on the bottom of the main window;
- hide the main window and the title bar (press ESCAPE to restore them);
- switch to the Watch List and Plot window;
- open Spectrum Lab's Command Interpreter window;
- access some other screens, mainly for debugging, which you will hardly ever use.
Hint: Windows which are already opened will be checked in the "View/Windows".
You can quickly switch between them, even if they are completely hidden by
other windows on the desktop, by pressing CTRL-F6 ("Switch between SL's open
windows"). This works a bit like the Windows task switcher (ALT-TAB), but
only switches through Spectrum Lab's own windows. But a few SL windows may
(or may not) be visible in the windows task bar.
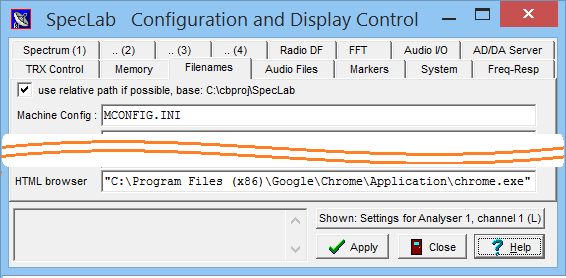
Help
Contains some topics of the help system and the inevitable "about"-box. The
help system only works properly if there is an HTML browser installed on
your system which supports jumps to anchors in the html documents through
the command line. For example, if help about the spectrum graph shall be
displayed, SpecLab invokes the browser with the command line argument
"../html/specdisp.htm#spectrum_graph" (or similar).
If the browser is too stupid to scroll to the anchor (like some Firefox versions),
try another browser. In the SL configuration, switch to 'Filenames' (tab),
and enter the full path and name of the browser (executable) in the
'HTML Browser' field (you can double-click into the field to open a file
selector dialog for *.exe files) :
So sorry to see you replaced by this browser, dear Firefox..
You can check the last command line that Spectrum Lab used to open the last
help topic: In the main menu, select 'Help' .. 'Show last browser command'.
Spectrum Lab looks for the path to the browser in the registry, first for
Firefox and Opera, and finally (if no other browser was found) it looks for
the key "HKEY_CLASSES_ROOT\htmlfile\shell\open\command".
The 'Help' menu also contains an item named 'Check for Update via Web Browser'.
Use this function occasionally. It will open a simple webpage, which checks
if your version of Spectrum Lab is still up-to-date, based on the program's
compilation date, which is sent through the HTML query string.
Please use this function if you experience problems, before reporting bugs,
as explained in the document about
'troubleshooting'.
back to top
Some typical configurations can be recalled from the "Quick Settigns" menu.
In contrast to the user-defined settings (in the lower part of that menu),
the following configurations are hard-coded in the program - so they don't
have to be loaded from an external configuration file. Most of these settings
are organized in categories (in the form of submenus), to avoid a bulky long
top-level menu. The following list may be incomplete since the program still
keeps growing:
- Note:
-
Besides the above 'built-in', aka 'hardcoded' entries
in the Quick Settings menu,
there may be some user-defined items below the horizontal line (separator)
after the item 'Restore all "factory" settings'.
See user defined menus for details,
including the name of the file in which the user-defined
menu items will be stored.
See also: main menu , help
index .
back to top
Spectrum Display
The spectrum display shows the spectrum of the analyzed signal as spectrum
graph and/or waterfall.
Both display types are explained here in more
detail.
As an overlay for the spectrum graph, a reference
curve can be displayed.
back to top
Control Elements and Tabs on the main window
The control elements are usually visible on the left side of the main window.
You can turn them off from the main menu ("View") to increase the visible
size of the spectrum display. (the different forms of the spectrum display
are explained in a separate document)
Some of the controls on the left side of the main window are explained
in the following sections. There is ...
Mainly used as a buffer-preview for long-term observations, there are also
some controls on the bottom of the main window:
-
The large-buffer-overwiew
-
Navigation buttons to scroll the spectrogram through the large buffer
Tabbed display control panel
There is a tabbed control panel on the left side of Spectrum Lab's main window,
showing...
Frequency control panel (in SpecLab's main window)
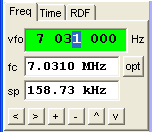
(frequency control tab)
Controls on the 'Freq'-tab in the main window:
- VFO (Variable Frequency Ocillator "tune frequency")
- Tuning frequency for the 'VFO' in an external SDR,
like SDR-IQ, Perseus,
or an external hardware controlled via CAT interface, Audio-I/O- or
ExtIO-DLL.
In configurations without 'controllable' frequency conversion, leave this field zero.
Note: In additon to the 'VFO frequency', there is another frequency offset which may
be added to the display - see Radio Frequency Offset .
- fc (center frequency for the spectrum/spectrogram)
- Can be used to set the displayed center frequency manually.
But in most cases, it's easier to move the main frequency scale with the mouse.
- sp (frequency span for the spectrum/spectrogram)
- Can be used to change the displayed frequency range.
But in most cases, it's easier to do this with the zoom buttons, or with the
content menu of the main frequency scale.
--- or, alternatively, instead of 'fc' and 'sp' : ---
- f1 (minimum frequency for the spectrum/spectrogram display)
- This an alternative to define the displayed frequency by 'fc' and 'sp' (center frequency and span).
- f2 (maximum frequency for the spectrum/spectrogram display)
- Together with 'f1', this is an alternative method to define the displayed frequency range.
Select between 'fc'/'sp' and 'f1'/'f2' with the options menu mentioned below.
- opt ('options' button on the 'Freq' panel)
- Opens a small menu with VFO / frequency related options:
- Frequency controls: Center frequency and span, or min- and max frequency
- Allows to switch between the two alternative style to define the displayed frequency range.
See explanation of the input fields 'fc'/'sp' and 'f1'/'f2' above.
- Include VFO frequency on frequency scale
- When checked, the 'VFO frequency' is included in the labels
on the main frequency scale.
When not checked, the main frequency scale shows the
'baseband' (or 'audio') frequency range.
- Synchronize 'VFO' frequency with the remotely controlled rig
- When checked, the VFO frequency will be transferred in both directions
(via CAT, CI-V, or similar):
Changing the frequency in SL's 'VFO' input field
(via keyboard or mousewheel) will also change
the radio's frequency. Vice versa, turning the radio's VFO knob will also
set Spectrum Lab's 'VFO' edit field, and optionally also modify the
main frequency scale. Without this option, only 'black-box' SDRs
without their own frequency controls will be controlled by SpecLab.
- Fixed display span at 1 pixel per FFT frequency bin
- When checked, the 'frequency span' (sp) is automatically
set to that each horizontal pixel position
on the spectrum/spectrogram exactly matches one FFT frequency bin.
- Disable auto-apply and increment/decrement for frequency input fields
- When checked, the 'frequency' input fields (VFO, display center, and display span)
behave as in older versions, without automatically 'finishing' the input,
and without the possibility to increase/decrease the current values via cursor keys
or mousewheel. Input to those input fields must then be finished manually with the ENTER key.
Values in the above 'frequency' fields can be entered directly (through the keyboard).
In addition, you can increment/decrement the current value with the cursor keys, or the mousewheel.
The cursor position (not to be confused with the mouse pointer) defines the stepwidth.
When typing a frequency into any of these three edit fields, you can
enter expressions like "135.8k" instead of 135800 if you like. The input will be converted
to the standard notation when pressing ENTER, unless the the 'auto-apply'
option is disabled in the 'opt' menu mentioned above.
Other tabs of this control panel are explained in the next chapter, and
-possibly- in other documents because there may be more tabs than in the
screenshot shown above.
See also: Help index,
Settings for remote VFO control via CI-V,
Displaying Icom's broadband spectrum.
back to top
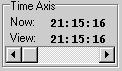
Time control tab
The "Time" tab shows the current time and the time of the latest waterfall
line. It may also be used for scrolling the waterfall "back in time".
If the spectrum line buffer is large enough (larger than the number of waterfall
lines on screen), you may scroll the time axis of the waterfall "back to
the past". Old parts of the waterfall which have already disappeared from
the screen can be made visible again, you may also zoom the old parts of
the waterfall using the controls on the "Frequency Axis"-panel or change
their color using the controls on the "Color Palette"-panel.
Shifting the slider on the "Time"-panel to the RIGHT will scroll the
contents of the waterfall back to the past. The waterfall will stop it's
real-time-scrolling as long as the time-slider is not in the leftmost position.
The FFT output will be recorded in the background then (but data collecting
will not stop).
This situation is indicated by the "Time"-panel changing its color from
the usual gray to a light cyan. As long as you see the "Time"-panel
in an unusual color, you know that the waterfall display is not in
"real-time"-mode but shows old data.
The amount of time (seconds, minutes, hours, or even days) is dictated by
the waterfall scroll rate in conjunction with the spectrum buffer size. The
spectrum buffer size can be modified
on a special tab of the configuration screen,
Shifting the time-slider back fully to the LEFT will return to "real-time"-mode.
The "Time"-panel also shows the current time ("NOW:") and the time when
the latest visible waterfall line has been recorded ("VIEW:"). In
"real-time"-mode of the waterfall there will only be a maximum difference
of one FFT calculation interval between the "NOW"- and "VIEW"- time.
The "Time" panel (like all other time-indicators in this program)
use UTC (=GMT) to be independent of the earth's timezones. If you don't see
the correct time shown in UTC on this panel, you should check the time settings
of your PC (double-click the time display in the task bar).
An alternative to the slider on the time-panel is the buffer-overview bar
on the bottom of the main window.
back to top
The RDF (Radio Direction Finder) tab shows a 'colour compass' for the waterfall
(spectrogram) in 'Colour Direction Finder' mode. This is a quite special feature,
with details explained in a different document (
colourdf.htm).
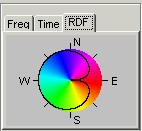
'Colour Compass' for the spectrogram in 'Radio Direction Finder' mode,
here with software nulling (cardioid pattern) for signals from the east.
In short form:
The colour (hue) indicates the direction to the transmitter in the spectrogram,
the brightness in the spectrogram indicates the signal intensity.
The signal don't necessarily have to be 'radio' signals. The system has been
successfully tested with two ultrasonic microphones mounted orthogonally (with
a 180° ambiguity for the direction) to locate bats.
The Cursor Position panel shows information about the current mouse (cursor)
location.
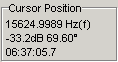
The display on the cursor-panel depends on the cursor display mode, which
can be switched by clicking on the frame of the cursor panel. Some of the
cursor display modes and -options are:
-
Simple (one or two independent cursors)
-
Delta (show frequency- and amplitude differences between the two cursors)
-
Peak-detecting within narrow frequency range (the range is +/- 4 pixels along
the frequency scale)
-
Amplitude from mouse-cursor, not from plotted data (only works in the spectrum
graph, not in the spectrogram).
If this option is selected, the displayed amplitude is not related to the
measurement, but only to the cursor position.
-
Let cursor #1 follow the mouse position
With this option, you don't have to click anywhere to change the position
of readout-cursor #1 (red).
-
Show info text near mouse pointer (shows frequency and amplitude of the mouse
pointer position as text near the pointer)
In "simple" cursor mode, the cursor display panel shows...
-
The upper line in the cursor box usually shows the frequency for the
mouse-position, or (if the readout-cursor is
fixed to a certain position), the frequency of
the cursor's fixed position. In peak-detecting mode, the frequency may vary
even if the pixel-position of the cursor (in the spectrogram) is constant
(like in fixed-cursor mode). The peak-detecting range is a few pixels
on the waterfall screen. The peak itself can be seen as a small green circle
in the spectrum graph. Note: the
displayed frequency has a larger resolution, and usually also a larger accuracy
than dictated by the FFT bin width, thanks to a special
interpolation subroutine.
-
The second line usually shows the frequency (in Hertz) and the amplitude
(decibel or percent) related to the mouse position.
In Radio-Direction-Finder mode, the cursor box also displays the direction
towards the transmitter of the displayed signal (note that this RDF is
frequency-sensitive).
-
The third line may show other infos, for example the timestamp when the waterfall
line under the cursor has been recorded (hr:min:sec).
If the control bar on the left side of the main window is switched off, the
cursor text is displayed on the right edge of the main menu, so the cursor
data can be seen even without the cursor display panel.
Note: Since May 2004, the text on the cursor panel can be selected with the
mouse, and copied into the clipboard (with CTRL-C as usual). This makes it
easier, for example, to transfer the peak-frequency into any other edit field,
calibration table, or any text document.
For some special applications, you can retrieve the frequency , amplitude,
and timestamp of the readout cursor with the interpreter function
spa.cursor.xxx .
The displayed data in the cursor window can optionally be fixed to a certain
frequency, no matter where you move the mouse. To achieve this, click into
the spectrogram near the "frequency of interest" with the right mouse button.
In the popup menu which opens, select one of the "Set Cursor To..." functions.
To switch back from fixed-cursor to mouse-cursor mode, select the function
"unlock cursor" in the waterfall popup menu.
back to top
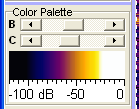
 The Color Palette panel on the main window shows all colors that are currently used for the
waterfall display (a kind of "color
legend").
The Color Palette panel on the main window shows all colors that are currently used for the
waterfall display (a kind of "color
legend").
The two sliders on the "Color Palette" control panel affect the brightness
(B) and contrast (C) of the waterfall colour assignment. This is an important
feature if you are digging for weak signals, because it allows you to enhance
the readability on the fly ! The palette looks a bit different if the waterfall
runs in Radio Direction Finder mode, but the B
& C controls work in both modes (in RDF/CDF mode, Contrast/Brightness
only affect the luminosity but not the color hue values).
-
Note:
-
If the brighness slider is labelled "b" (instead of "B"), the automatic
brightness control ("visual AGC") is
active.
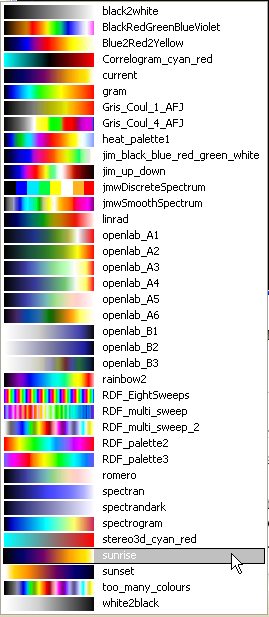
Click into the color bar to pick a different colour palette. All palettes contained
located in the 'palettes' subdirectory are displayed in the menu (see screenshot on the right side).
If necessary, additional colour palettes can be created with SL's built-in
color palette editor.
At the lower side of the color control panel is a scale which usually shows
some decibel values. Double-click into the decibel scale to open SL's
settings dialog
where you can modify the visible amplitude range (usually specified in dB, but linear scales are also possible).
Note: Instead of cranking up the "contrast" slider to the maximum (to
dig weak signals out of the noise), you can also reduce the 'Displayed Amplitude
Range' in the spectrum display configuration as explained
here . For example,
if the "interesting" signals are all in the range -60 dB to -50 dB, don't
use an amplitude display range of -120 dB to 0 dB (instead, use -70 dB to
-40 dB ).
See also: palette editor ,
visual AGC
, help index
back to top
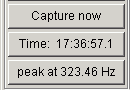
This button on the left side of the main window (under the contrast / brightness
slilders) has different functions, which will be shown as a text on this
button.

The button's surface may...
-
Show the current size of a log file (if file logging is active) and stops
file logging
-
Show the current position in the analyzed input file (if
file analysis is active) and stops file analysis
-
Show error messages like shortage of buffer memory or too slow CPUs (during
"normal" operation)
-
Show a hint as long as there are not enough samples collected for full spectral
resolution
(i.e. "waiting for more data until the first FFT can be calculated" or "showing
a preliminary, zero-padded FFT
")
Clicking on the progress button can take you to a more detailed error
description, or clear (acknowledge) a certain message .
back to top
On the left side of the main window, there are a few programmable buttons
(which you can only see if the window is large enough..). These buttons are
completely user programmable, both the text in the button, and the function
which will be executed when the user clicks one of these buttons.
To execute the button's programmed function, click it with the left mouse
key or press enter when it's selected.
To change the button's programmed function and its text, click it with the
right mouse key to open the following dialog:
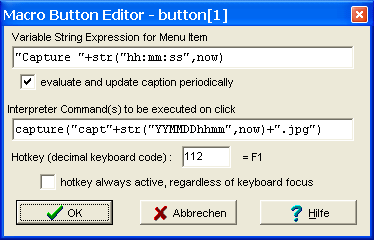
The field "variable String Expression for button text" defines the
text on the button's face (caption). This can be a simple fixed text string
(embedded in double quotes), or a combined string expression like this:
"Time: "+str("hh:mm:ss.s",now)
More about this can be found in the description of Spectrum Lab's built-in
interpreter, look for "string
expressions" there. If the button text is not a fixed string but a variable
expression, set the checkmark "evaluate and update caption periodically".
The field "Interpreter Command(s) to be executed on click with left
button defines what shall happen when the user clicks a programmable
button. This is usually a sequence of interpreter commands
(explained in another document), but it is also
possible to run external programs this way using the
"exec" command.
In the screenshot above, the 'capture' command is used to produce a screenshot
which contains the current date+time in the filename whenever the user clicks
on the self-defined button "Capture now". However, you can do an awful lot
of other things with the programmable buttons once you know how to use Spectrum
Lab's built-in command interpreter.
The field "Hotkey" allows you to define a hotkey for the programmable
button. Pressing the hotkey will have the same effect as clicking on the
button with the left mouse key (see above). An empty hotkey, or the value
zero means the button can only be activated with the mouse, but not through
the keyboard. The keyboard-combination must be entered as a decimal value
(windows "virtual key" code, see below). The code can be easily found by
clearing the hotkey field, and pressing the hotkey (on the keyboard, for
example F1). If the hotkey edit field is empty, it will automatically be
filled with the decimal value. A few decimal keyboard codes are shown below.
| F-Key |
F1 |
F2 |
F3 |
F4 |
F5 |
F6 |
F7 |
F8 |
F9 |
F10 |
F11 |
F12 |
| code (without SHIFT etc) |
112 |
113 |
114 |
115 |
116 |
117 |
118 |
119 |
120 |
121 |
122 |
123 |
| with SHIFT key (= code + 256) |
368 |
369 |
370 |
371 |
372 |
373 |
374 |
375 |
376 |
377 |
378 |
379 |
| with CTRL key (= code + 512) |
624 |
625 |
626 |
627 |
628 |
629 |
630 |
631 |
632 |
633 |
634 |
635 |
With the option
'hotkey always active, regardless of keyboard focus'
set, the programmable button can even be activated via its hotkey if the keyboard focus (aka 'input focus')
is currently on a different window. Without this option, the buttons can only be active if the focus
is on Spectrum Lab's main window.
Usually the programmable buttons are used to invoke interpreter commands (as explained above).
But those buttons on the left side of the main window can also be controlled through SL's command interpreter.
Here is an example to change the background colour of the first (i.e. topmost) button:
button[1].color = 0xC0FFFF : REM change background to light Cyan
The format of the hexadecimal colour codes is similar to HTML: 0xRRGGBB, where each of the three components (RR=red, GG=green,
BB=blue) ranges from 00 = minimum to FF = maximum brightness. 0x000000 is black, 0xFF0000 is pure red, 0x00FF00 is pure blue, 0x0000FF is pure green,
0xFFFFFF is bright white. A negative colour value restores the button's dull grayish background colour.
If the button number is omitted, the interpreter will access the button which is currently been 'executed' (eg. clicked).
This way, a button can change its own colour when clicked, or when its hotkey is pressed.
See also: String expressions,
command- and function overview,
Index .
Controls on the bottom of the main window
To open an additional control bar on the bottom of the main window, select
"View/Windows"..."Control bar on bottom" in the main menu. Some of the controls
in the bottom bar are explained below (but not all, because this is still
"in the making"). If this control bar is visible, the bottom of the main
window may look like this:

The screenshot also shows a part of the main spectrogram. The bottom control
bar below it contains an overview of the spectrum buffer (which can be configured
through a menu). It only makes sense to turn this control bar on if the spectrum
buffer covers a larger timespan than the main spectrogram. If you don't need
this control bar, turn it off using the popup menu in the lower right corner.
The Spectrum Buffer Overwiew (in the bottom control bar)
The narrow spectrogram in the control bar contains an overview of the buffer
contents. By default, the whole buffer is visible, but you can also zoom
in with the buttons on the right side. The part of the buffer which is visible
in the main spectrogram is marked with a small red or green rectangle. Red
colour means "the main spectrogram is scrolled back in time", green colour
means "the main spectrogram shows the most recent data, it is NOT scrolled
back".
To scroll back and forth, you can grab the indicator rectangle with the mouse
and move it left or right. Because the overview may be zoomed, you can
alternatively use the navigation buttons which are explained below.
Navigation buttons to scroll through the spectrogram buffer
The two buttons next to the overwiev can be used to scroll the main spectrogram
through the buffer, page-by-page (the left button jumps further into the
past, the right button from past to present, until the indicator turns green
as explained above).
The two zoom-buttons can be used to zoom the buffer overwiew (they do NOT
affect the main spectrogram !). This is helpful if the buffer contains a
really HUGE amount of spectrum lines, for example from an overnight recording.
The menu button in the bottom control bar opens a small popup window where
you can find some options for the spectrogram overview, one of them is to
open the configuration screen with the
spectrum buffer settings.
Last modified : 2021-05-15 (fixed chapter numbering via CSS)
Benötigen Sie eine deutsche Übersetzung ? Vielleicht hilft
dieser Übersetzer - auch wenn das Resultat z.T. recht "drollig" ausfällt !
Avez-vous besoin d'une traduction en français ? Peut-être que
ce traducteur vous aidera !