%20logo.jpg)
%20logo.jpg)
%20logo.jpg)
%20logo.jpg)
The 144 MHz (2
metres) band is the mainstay of the VHF bands around the World. It is on this
band that most radio amateurs will have their first QSO and it is here that most
local contacts will take place on FM. However, this band also offers some
excellent opportunities for DX (long distance) communications using exotic
propagation modes such as aurora,
Meteor Scatter,
Tropo
Ducting and
Sporadic Es to mention only a few.
|
Callsign Lookup
|
|
|
Search VHF-Database
Maintenance by Guy DL8EBW, Ansgar DG2KBC
and Bernd DK3XT
|
|
|

|
|

|
|
Height
km |
VHF
Propagation modes |
|
|
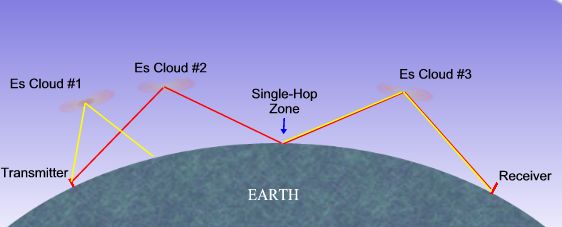
Different propagation modes enable VHF/UHF signals to travel
further than normal
'line
of sight'
because they are reflecting your signals from different heights, above sea
level, in the Earth's atmosphere.
Tropo Scatter
takes place below
10,000m (10km)
height (Mt. Everest is by comparison
8,850m
high), whereas
Meteor Scatter mostly occurs at
90km height and
Sporadic Es
at 110km height, allowing much
greater distances to be achieved.
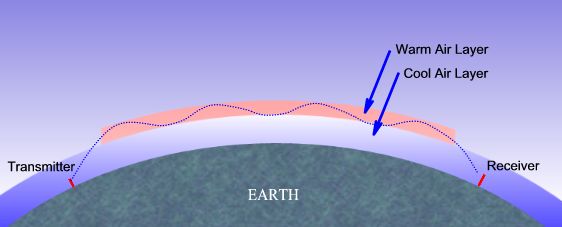
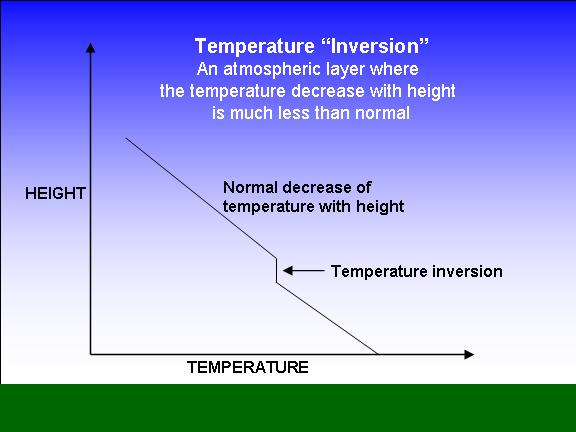
The exception is
Tropo Ducting,
between 450-3000m
height asl, where the signals are trapped between layers of hot and cold air
(temperature inversion) and if over a good calm sea path may extend for huge
distances. Contacts between Scotland and the Canary Islands on
144MHz have been
achieved this way.
Why are
Auroral signals shown to typically achieve a lesser distance than
Meteor Scatter even though the reflection takes place at a
greater height in the Atmosphere? They do actually travel further reflected
off the Auroral curtain near the Arctic and back again, but the receiving
station may be a lot closer to you in Europe.
The International space station and the
Space Shuttle are both over 200km
height.
|
|
|
VHF/UHF Propagation modes explained
|
|
Propagation type
|
Distances
|
Comments for European stations |
|
Line of sight
|
0-50 km
|
Dependant upon
antenna height above sea level and diffraction can extend distances to around
110 km |
|
Knife edge diffraction
|
50-110km
|
Your LOS signal, which can be blocked by
high terrain can sometimes be diffracted or bent over the top of the
obstruction, particularly in mountainous areas.
Software calculator here |
|
Tropo
Scatter
|
110-700km
|
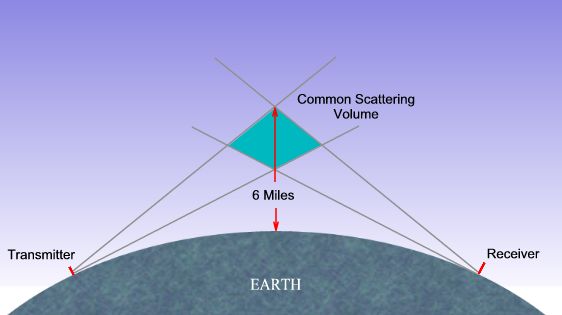
Available all the
time. |
|
Aircraft Scatter
|
200-500km |
Subject to rapid
fading of signals |
|
Aurora
|
250-1100km
|
Favours Northern
Europe. March often good |
|
FAI
|
250-1100km
|
May to August, favours Southern Europe |
|
Tropo
Ducting
|
200-4700km
|
Sea path possible
exceptionally up to 3000km. October often the best month.
Blocked by higher mountains.
Click here for
atmospheric temperature soundings.
Select Europe map and then click on
site to view
readings. Look for temperature inversions, where the inversion thickness layer is
wide enough to support ducting at 144 &
432MHz, using the table below.
|
Inversion thickness required
|
| Feet
|
Metres
|
Band
|
MHz
|
| 300 |
91 |
UHF |
432 MHz
|
| 600 |
183 |
VHF |
144 MHz
|
|
|
Meteor Scatter
|
500-2350km
|
Summer months best for major showers, but winter months
active too.
|
|
Sporadic E (Es)
|
144MHz
1400-2350km
(Single hop)
Up to 3600 km
(Double hop)
|
Sporadic E (Es)
at mid-latitudes occurs mostly during summer season, from
May to August in the
Northern hemisphere and from November to
February in the Southern hemisphere. There is no single cause for this
mysterious propagation mode. The reflection takes place in a thin sheet of
ionisation around 90 km height. The ionisation patches drift westwards at
speeds of few hundred km per hour. There is a weak periodicity noted during
the season and typically Es is observed on 1 to 3 successive days and remains
absent for a few days to reoccur again. Es do not occur during small hours,
the events usually begin at dawn, there is a peak in the afternoon and a
second peak in the evening. Es propagation is usually gone by local midnight.
Sporadic E (Es)
clouds have been observed to initially occur within approximately 150
km (90 mi) to the East of a severe thunderstorm cell complex in the
Northern hemisphere, with the opposite being observed in the Southern
hemisphere. To complicate matters is the fact that
Sporadic E (Es)
clouds that initially form to the East of a severe thunderstorm
complex in the Northern hemisphere, then move from ESE-WNW and end up
to the West of the severe thunderstorm complex in the Northern
hemisphere. So one has to look for
Sporadic E (Es)
clouds on either side of a severe thunderstorm cell complex. Things
get even more complicated when two severe thunderstorm cell complexes
exist approximately 1000–2000 miles apart.
Not all
thunderstorm cell complexes reach severe levels and not all severe
thunderstorm cell complexes produce
Sporadic E (Es).
This is where knowledge in Tropospheric physics and weather
analyses/forecasting is necessary.
144MHz
2,350km is max single hop distance.
144MHz
Sporadic E (Es)
season
is from June to July.
Rare double
hop possible? |
The 144 MHz (2
metres) band is the mainstay of the VHF bands around the World. It is on this
band that most radio amateurs will have their first QSO and it is here that most
local contacts will take place on FM. However, this band also offers some
excellent opportunities for DX (long distance) communications using exotic
propagation modes such as aurora,
Meteor Scatter,
Tropo
Ducting and
Sporadic Es to mention only a few.
The key to working long distances on
50, 70 & 144MHz is often simply knowing when band conditions
are much better than normal, and knowing on which frequency the DX stations are
operating. In recent years DXcluster sites have greatly assisted to identify
openings and there is now available an excellent piece of software for Live MUF
(Maximum useable frequency) monitoring in the form of
LIVE MUF V.7 by G7RAU
& EA6VQ.
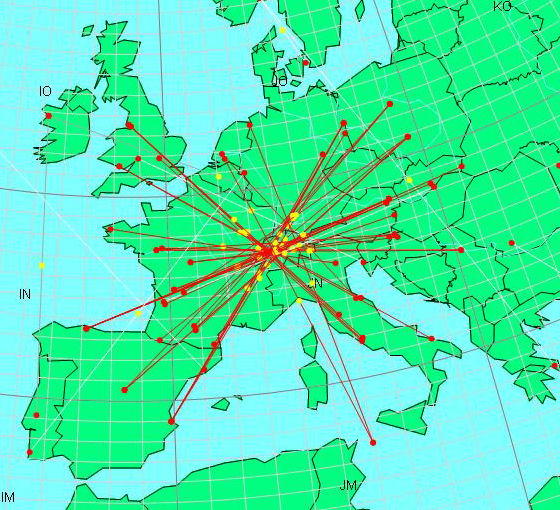
You can watch on a live map the DX paths
being plotted and see the location where the Sporadic E ionised region/cloud is
located. It is where all the lines intersect. Seeing the MUF rise to over
50MHz, then
70MHz, then 100MHz you
will know that there is a good chance of the MUF reaching
144MHz; you will also know in which direction to beam and you could be
the first to work the DX!
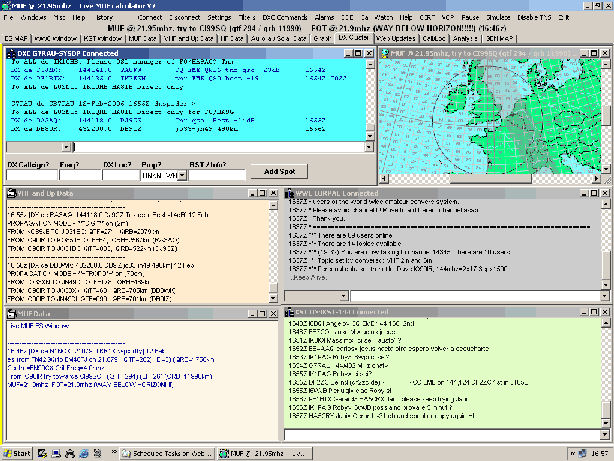
Today, Friday 14th July 2006, I was able to
observe this in action. The screenshots below were saved by me to show you some
of the functions of the
LIVE
MUF V.7 software. The red dots indicate
spotting stations or DX stations, with the
red lines showing the 144 MHz path between them. The yellow dots show the 1/2 way path
point. The mode of propagation here is Sporadic E. As you can see there is a
clear grouping of yellow dots over Switzerland, this is where the
Sporadic E reflecting area
was located.
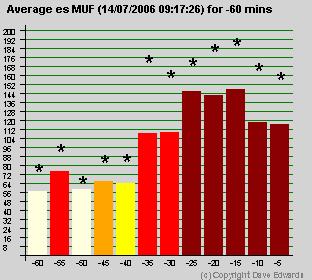
The smaller average MUF graph below, shows
the average frequency the MUF reached (for the same period as the previous map) with the frequency scale up to
200 MHz shown to the left and for the last 60
minutes. The asterisks show the maximum MUF a spot provided when the
calculations were made. This shows that for the 2m opening above that the
average MUF reached around 145MHz for 15 minutes,
but that some contacts suggested frequencies as high as
190MHz might be possible. Having watched the MUF steadily rise I was able
to have the advance warning I needed, but still didn't many to catch anyone from
here in IO84 square on this occasion.
This combined software and DX cluster
approach is much more likely to provide you with prior notice of major openings,
than from the old fashioned way of monitoring the 2m calling frequency of
144.300 MHz or by listening to the beacon
frequencies. However monitoring these frequencies continues to
provide valuable opportunities for catching rare DX, if you are the first to
hear it!
One popular theory for Sporadic Es used to be that they were caused
by thunderstorms, however when I checked on the
Animated Lightning Map for Europe,
there was none apparent for the above 144MHz Es, so it must
have been another mechanism. The Sporadic E cloud can often be observed to
travel at very fast speeds over Europe and the peak season is from late May to
early August. June and July are the best months with openings lasting from a few
minutes to over an hour.
Tropo
Ducting (TrD) can
lead to even longer distances on 144MHz than the
Sporadic E single hop maximum of 2,350km. Tropo
ducting occurs when there is a
temperature inversion. This often occurs when
there is fog and steady high pressure over a number of days. The greater the
size of the inversion duct or 'pipe' the lower the frequency that will be
trapped within. This means in practice that as the inversion gets larger
microwave frequencies will be supported first, then UHF, then lastly VHF. An
inversion of around 600feet (138m) depth is required to support
144MHz signals.
|
 |
|
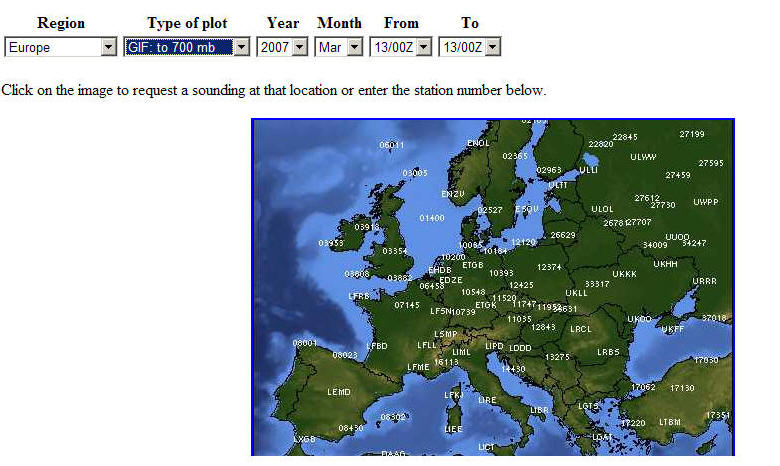
A valuable source for
vertical profiles of dew point, air
temperature, wind speed, wind direction
and many more parameters is also provided by the
University of Wyoming, Department of Atmospheric Science.
Having selected the continent of
interest, you may choose various types of plots. I suggest you use the "GIF:
to 700 mb"
(see the blue highlighted area above), which will generate a picture displaying the
vertical profile of dew point and air temperature - a perfect tool to
identify Tropospheric ducting. Before you can retrieve the data, select a
site (airport) to request a sounding at that location.
Click the map image above to access
the upper air sounding data. The two examples below show first normal
conditions and secondly Tropo ducting. |
|
 |
 |
The
animated image
on this link (9mB file!) shows vertical wind shear
for the period 11th to 16th July 2006. This covers the date of the opening above
around 0900hrs UTC on 15th July 2006. I think the wind
shear probability for Switzerland appears to be Low. Does this help to disprove the suggested link between Wind shear
and Sporadic E, as the mechanism that permits such long distance propagation?