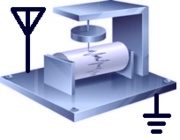
 MDSR RF
Seismograph
 MDSR RF
Seismograph
MDSR & RF-Seismograph;
measuring shortwave propagation
with your own transceiver or receiver!
How is the RF seismograph connected to the transceiver/receiver
Video of the
Solar Eclipse Presentation explaining all the findings
and the turbulent solar eruptions during the eclipse
(opens in a new
tab)
The presentation material in PDF
form of the “Solar Eclipse Wrap-up”
presentation (use freely)
.
Scanning
using the RF Seismograph: Live Seismograph Propagation
List
How
to read the graph:
When the line goes wide
there is propagation but not necessarily a man-made signal. The
absolute value of the noise level is not important for
propagation, but it is interesting to watch how the noise changes
over time. Slow changes are usually made by the ionosphere (5 min
and longer). The slower the rise of the signal the further away
it originated. Fast changes are man-made signals and
earth-quakes, hence vertical lines. The black bottom graph is
easier to read when it comes to propagation. The grayscale
indicator shows propagation for all the bands according to color
codes as in the sig/time graph. White is best propagation.
How does it work? It monitors JT65 frequencies on 6 HF bands for 8 s each, repeating the scan every 52 s. The recorders log the background noise of the band and display the result in six color-differentiated long-duration time graphs. The total displayed time is 6 h.
Where is it located? The
monitor station is located in Lynn Valley (GS: CN89li), North
Vancouver at 130 m (500 ft.) ASL.
The transceiver used to monitor the HF spectrum is a Yaesu FT-950
connected to an omni-directional multiband antenna (Hy-Gain
Hy-Tower 18HT Jr., 36 ft in height).
The transceiver is connected to the computer via an MDSR BiLiF
converter. The software running on this computer is MDSR V3.1 and
Java SA 1.6. (the Windows version of the software).
Signals are present when the graph resembles a tiny filled
square. The up/down movement of the graphs is caused by changes
in noise level, and by the reflection of noise off the D-Layer in
the ionosphere.
For more information, and a guide to setting up the RF Seismograph on your website, please e-mail: [email protected]
Thanks to Adam and everyone at NSARC for setting up this page.