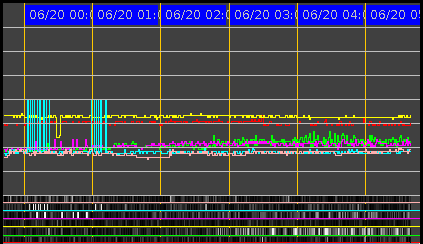
How to read the graph: When the line goes wide there is propagation but not
necessarily a man-made signal. The absolute value of the noise level
is not important for propagation, but it is interesting to watch how the
noise changes over time. Slow changes are usually made by the
ionosphere (5min and longer). The slower the rise of the signal the
further away it originated. Fast changes are man-made signals, hence
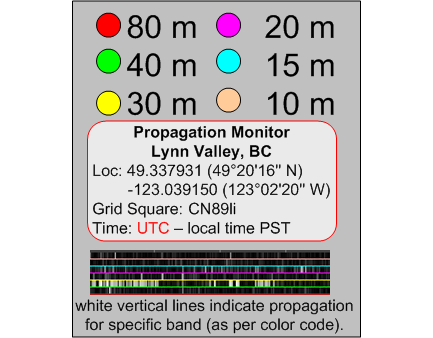
vertical lines. The black bottom graph
is easier to read when it comes to propagation. The grayscale indicator
shows propagation for all the bands according to color codes as in the
sig/time graph. White is best propagation.