Aurora is caused
by interaction between the Earth's magnetic field
and the solar wind (a mix of charged particles
blowing away from the sun). During solar
storms, enough of these charged particles make it
through to the Earth's upper atmosphere that they
interact with the earths natural magnetic field
lines. When enough of these particles
collide, energy is released in the form of
auroral light. In addition to creating a
pretty light show (mostly in upper latitudes),
radio signals scatter off of these particles and
can greatly enhance propagation on 6 meters and
above. High levels of aurora can also make HF
propagation via polar routes difficult.
This chart shows
X-ray flux levels as measured by the GOES-8 and
GOES-10 satellites. The GOES-8 measurements
(shown in red) are used to issue "solar
alerts" when X-ray flux levels exceed
certain levels. Spikes on the chart
correspond to solar flares. Flares are
considered "significant" when flux
levels rise above the "M" level (as
shown on the right side of the chart).
These large flares can often wipe out the bands
almost immediately and it can take minutes to
hours for the bands to recover. If the
bands seem to go dead all of a sudden, it is
always a good idea to check this chart to see if
a large flare has occurred recently.
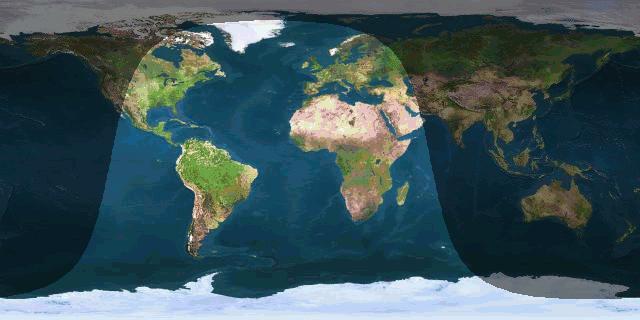
The grey line is
a band around the Earth that separates the
daylight from darkness. Propagation along
the grey line is very efficient. One major
reason for this is that the D layer, which
absorbs HF signals, disappears rapidly on the
sunset side of the grey line, and it has not yet
built upon the sunrise side. This map shows
the current position of the grey line terminator.
The following map
shows Maximum Usable Frequencies (MUFs) for 3000
kilometer radio signal paths. More
importantly, the current sunspot number (SSN) and
Planetary A-index are updated every 30 minutes on
the bottom of this image. Additionally, the
grey line position, auroral ovals, and sun
position are provided. Click on the map for
more details on how to use it.
The images below
are current views of the sun shown at different
wavelengths of light as taken by SOHO and the
Yohkoh soft-Xray telescope. Generally, more
bright regions on the disk indicates more solar
activity, which usually leads to higher solar
flux levels (which usually leads to better
propagation!). Click on any thumbnail to
view a larger image.
SOHO - 17.1nm
SOHO - 19.5nm
SOHO - 28.4nm
SOHO - 30.4nm
Yohkoh
Soft X-rays
Sometimes you may see
"CCD Bakeout" instead of the solar disc
images. This occurs when NASA does routine
maintenance and calibration on the cameras.
For a more technical explaination, read NASA's CCD Bakeout
explaination.
PROPAGATION --> Hottest
new propagation page on the web. Contains
many indicies and reports that are
dynamically updated as soon as new
information is available. -- From QSL.NET;
Solar Terrestrial Activity
Report
--> By Jan Alvestad -- Recent
solar and geomagnetic data (updated daily);
Solar WIND and electron fluence charts (updated
daily); Solar cycles 21-23, [Solar cycles
1-20; Graphical comparison of cycles 21,
22 and 23;