
 Compare the DR2W propagation tool with VOACAP
DR2W and VOACAP are both tools for long-term prediction of radio propagation, but they operate differently and have different strengths.
VOACAP is based on empirical data and provides a scientifically recognized model for predicting radio propagation, including point-to-point path loss and coverage.↗
DR2W's mechanism is less detailed in the available descriptions, and it's noted as being potentially more effective for shorter distances compared to VOACAP.↗
Similarities:
Calculation Method:
VOACAP and DR2W, both employs smoothed sunspot counts statistical functions.
Input Parameters:
Both tools require similar types of input of parameters like transmitter power, antenna gain, frequency, and location of both transmitter and receiver.
Output:
Both tools provide similar types of output, including maps of predicted signal strength, signal-to-noise ratio (SNR), and graphs of the predicted performance of various propagation modes (such as ground wave, sky wave, and ionospheric scatter).
Differences:
Visualization:
DR2W includes a 3D visualization of predicted signal clarity, useful for visualizing the effects of terrain.
Ease of Use:
DR2W has a more user-friendly interface compared to VOACAP, and it's generally easier to use.
Flexibility:
VOACAP provides more flexibility and customization options for advanced users.
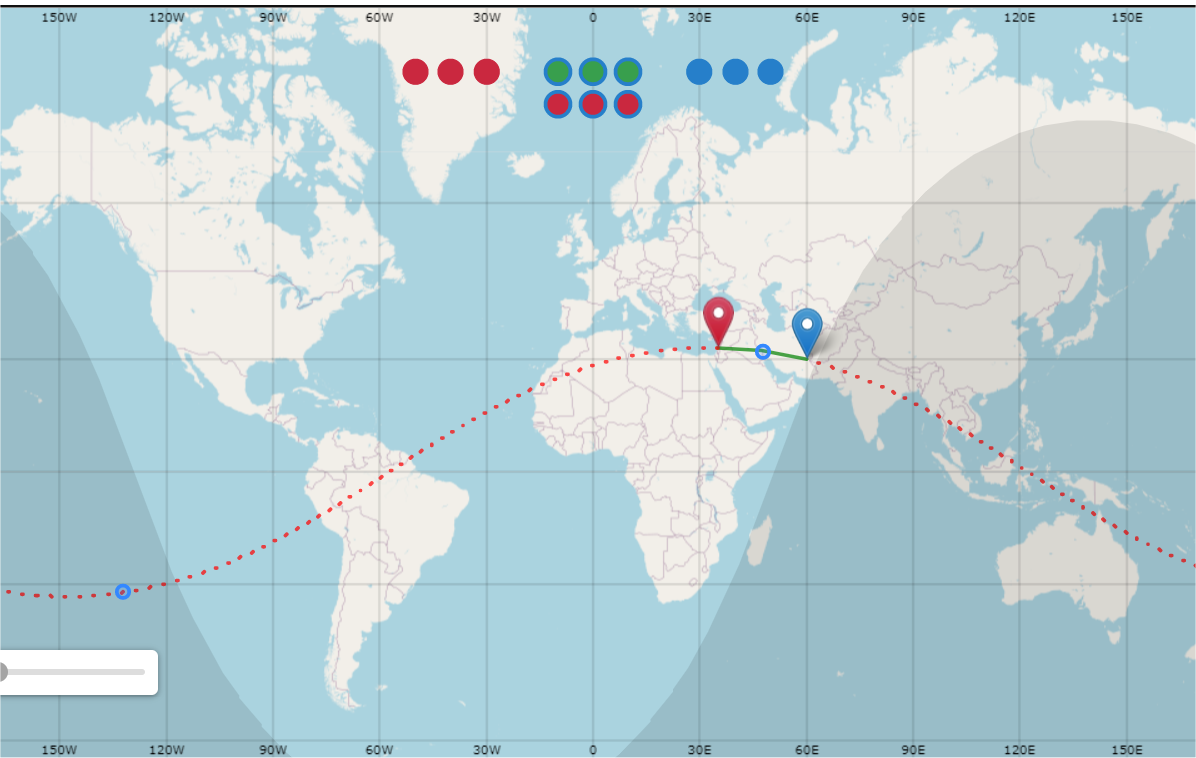
Red area is better propagation, showing SNR dB, while blue is worse.
Accuracy: VOACAP and DR2W both have their strengths and weaknesses, and the accuracy of the predictions can vary depending on the specific situation. In general, VOACAP is considered to be more accurate for longer distance predictions, while DR2W is apparently better for shorter distance predictions.
In summary, both DR2W and VOACAP are useful tools for predicting radio propagation, and the choice of which tool to use will depend on the specific situation and the user's needs and preferences. Choose VOACAP for in-depth, long-distance radio propagation analysis requiring detailed inputs. Consider DR2W if you are looking for a potentially simpler, shorter-distance prediction tool.
See links: DR2W propagation tool and VOACAP.