Some links
updated July 9, 2014
Weather
QuickLinks
The Best Weather and
Hurricane Information
The
Emergency
Managers Weather Information Network (EMWIN) is the fastest
way to get weather alerts. Listed below are methods of receiving
EMWIN.
1. EMWIN data downlink from satellites is the best method.
2. Receiving radio rebroadcast of EMWIN data provided by
volunteers is a good method but they are too few and do not cover
most areas. It requires radio data decoders.
3. The Internet using automatic-push EMWIN software. It is a fair
method and the cheapest but least reliable way. There are many
places for connection failure from your ISP, telephone, and/or
cable.
Other
new ways of getting weather data using software on your computer
is listed below:
http://www.nws.noaa.gov/noaaport/html/noaaport.shtml
http://www.noaaport.net/
http://www.climateweather.net/
http://www.opennoaaport.net/
http://www.nws.noaa.gov/nwws/products.htm
http://www.nws.noaa.gov/tg/dataprod.html
EMWIN software is excellent for
getting weather text warnings within a minute of their official
time-stamped releases. Selected text products can be set to pop-up
or sound alarms while you do other things on your computer. The
graphic files are low priority and thus are not rapidly updated,
so it is better to manually-pull graphic files using an Internet
browser. When first opening an EMWIN program it is recommended to
check for weather text alerts sent either to your email address
or to manually-pull weather text using an FTP plug-in or an
Internet browser. This is because you can miss valid text alerts
that are still in effect before the time you run the EMWIN
program. Also recommended is storing the incoming data on a ram
drive instead of constantly working the hard drive. The automatic-push
EMWIN software should include alarms, the ability to save only
certain information and filter options. The disadvantage to EMWIN
software is it can be difficult to setup after first installing
it.
http://noaaport.uprrp.edu:8016/ EMWIN data
examples manually-pull
NOAA Weather Radio is an excellent way to get weather alerts and it should be used in conjunction with using EMWIN.
The Amateur Radio Emergency Service is an extremely reliable and fast way to get weather alerts. What can happen in a wide area disaster is major power outages. Television and cable can go out. Telephones can become over loaded or go dead. Cell phone networks and the Internet can overload and become totally useless. The 911 system can fail. Police, fire, rescue and hospitals may become overworked and too busy with others and unable to help you. A satellite dish can completely loose signals from very heavy rain, from being blown just slightly off bore-sight, or just damaged enough to cause no signal. There can be loss of all communications except for the Amateur Radio Emergency Service.
The Amateur Radio service and radio scanners should be a part of your
survival tools.
http://www.google.com/search?as_q=skywarn&as_epq=amateur+radio&num=100
http://en.wikipedia.org/wiki/Skywarn to collect reports of localized
severe weather
http://www.findu.com/cgi.html Find Amateur Radio Weather APRS
Stations
http://www.wulfden.org/APRSQuery.shtml Search Amateur Radio Weather
APRS Stations
Warnings
for Severe Storms, Tornadoes, and Other Hazards
NOAA
Weather Radio is a fast source
for comprehensive weather and emergency information.
One of the most important reasons to own a weather radio is the
ability to receive up to the minute information on severe weather.
If you are under a Warning it is best to leave the weather radio
audio on to get non-alarm Weather Statements that can contain
more important information than just Warnings! Also, the audio
needs to be on because a storm can knock the weather radio
station off the air. Most stations have a backup channel that
covers the same county so you can switch to that weather radio
channel. Check the local National Weather Service office's web site to find what channels to use.
_
Notice the date
and time! Missing and out-of-date data results in not showing the
latest updates!
Text products indicate the expiration date and time (UTC
time) about the third line
from top along with the county zone numbers.
Warning Maps
http://140.90.113.200/ or http://www.weather.gov/ Better
detail and faster updates if you click on map area
http://140.90.113.200/view/largemap.php or http://www.weather.gov/view/largemap.php
http://www.spc.noaa.gov/products/wwa/ Auto-Refresh 5 min. Watch, Warning, Advisory Maps
http://www.spc.noaa.gov/products/wwa/wwa.gif
http://www.spc.noaa.gov/products/wwa/warnsummary.html Auto-Refresh 5 min.
http://www.weather.gov/view/national.php?thumbs=on This will replace iwin.nws.noaa.gov
http://www.arl.noaa.gov/ready-bin/getwarn.pl?product=Current+Watch+Boxes+Plotted+on+a+Map [shows only
watches]
http://www.hamweather.net/cgi-bin/hw3/hw3.cgi?forecast=pass&pass=warningmap&s=us Good!
Needs faster reload/refresh
http://www.wunderground.com/severe.asp/ Good! Needs faster
reload/refresh Auto-Refresh
15 min.
http://www.stormdisplay.com/warnings.asp Auto-Refresh
5 min. javascript
http://www.met.tamu.edu/weather/warnings/ Auto-Refresh
5 min. Good! County maps but
if using Netscape readme
http://www.atmo.arizona.edu/gifs/SEVERE.GIF
http://image.weather.com/images/maps/special/severe_us_720x486.jpg [overwrite us: cn ec nc ne nw sc se sw wc]
http://image.weather.com/images/maps/special/us_watch1_720x486.jpg
_
Warnings (text only)
http://140.90.113.200/view/ or http://www.weather.gov/view/ iwin.nws.noaa.gov will be discontinued replaced by this
link
http://weather.noaa.gov/ select State then
select under Forecasts, watches and warnings
http://www.arl.noaa.gov/ready/cmet.html at Text Products
select Watches and Warnings
http://www.arl.noaa.gov/ready-bin/ldmwxa.pl?ldmwxproduct=Watches+and+Warnings enter 3-letter
station ID or state ID preceded with @
http://kamala.cod.edu/svr/ Auto-Refresh
2 min. Very Good! Quick
text list of warnings.
http://apollo.lsc.vsc.edu/weather/weather.html enter 3-letter
station ID or @ state ID and Select Data NWS Warnings
http://www.met.tamu.edu/personnel/students/weather/weather_interface.html enter 3-letter
station ID or @ state ID and select data category Other Data
http://www.met.fsu.edu/weather/text_weather/ select
Bulletin type 'warnings ans watches' and enter Station '@fl' or
with your 2-letter State ID
http://www.stormdisplay.com/current.asp Auto-Refresh 5
min.
http://www.weatherforyou.com/cgi-bin/hw3/hw3.cgi?forecast=pass&pass=warningmap&s=us&size=640x480&key=1 Auto-Refresh 5
min.
http://twister.sbs.ohio-state.edu/main.php?pageloc=severe
http://www.atmos.albany.edu/cgi/quick.cgi?station=@fl&warn=yes Replace @fl with
your 2-letter State ID
http://www.weather.brockport.edu/cgi-bin/warning?station=@fl&time=Latest Scroll down for
latest. Replace with your 2-letter State ID
http://www.weather.brockport.edu/cgi-bin/warning?station=@fl&time=Today Clear&Reset
for '=Today' at 0000 UTC
http://www.weather.brockport.edu/cgi-bin/warning?station=@fl&time=Yesterday Replace with your
2-letter State ID or 3-letter NWS ID
http://wwwagwx.ca.uky.edu/ldmdata/public/Alertwx.html Scroll
to bottom and select State
_
Raw directory and parsed file listing of combined products:
http://www.atmos.albany.edu/weather/data1/severe/?C=M;O=D Includes some
hurricane data
http://wwwagwx.ca.uky.edu/ldmdata/severe/?C=M;O=D
Radar Nationwide loop
_
Page moved
to radar.htm
Radar Nationwide
_
Page moved
to radar.htm
Thunderstorms
- Tornadoes - Severe Weather - Convection Forecasts
_
http://www.spc.noaa.gov/ or http://w1.spc.woc.noaa.gov
Severe Storm Predication Center Auto-Refresh 5 min.
http://www.spc.noaa.gov/products/ Auto-Refresh 10 min.
http://www.spc.noaa.gov/products/outlook/ Auto-Refresh 10 min.
http://www.spc.noaa.gov/products/exper/enhtstm/ Auto-Refresh 10 min.
http://www.spc.noaa.gov/products/outlook/day1otlk.html Auto-Refresh 10 min.
http://www.spc.noaa.gov/products/outlook/day2otlk.html Auto-Refresh 10 min.
http://www.spc.noaa.gov/products/outlook/day3otlk.html Auto-Refresh 10 min.
http://www.spc.noaa.gov/products/exper/day4-8/ Auto-Refresh 10 min.
http://www.spc.noaa.gov/products/wwa/ Watches, Warnings,and Advisory Maps Auto-Refresh 5 min.
http://www.spc.noaa.gov/products/wwa/wwa.gif
http://www.spc.noaa.gov/products/wwa/warnsummary.html Auto-Refresh 5 min.
http://www.spc.noaa.gov/products/watch/ Convective Watches Auto-Refresh 5 min.
http://www.spc.noaa.gov/products/md/ Mesoscale Discussions Auto-Refresh 5 min.
http://www.spc.noaa.gov/exper/ Auto-Refresh 10 min.
http://www.spc.noaa.gov/exper/mesoanalysis/ Auto-Refresh 1 min. The area depicted on this page will change from day to
day, and will generally show a region where the SPC is closely
monitoring for severe thunderstorm development. Updated hourly
http://www.spc.noaa.gov/compmap/ Auto-Refresh
20 min. (javascript)
http://www.spc.noaa.gov/compmap/16.gif National Enhanced
IR Satellite Image
http://www.spc.noaa.gov/obswx/maps/ Surface and Upper Air Maps Auto-Refresh 15 min. (javascript)
http://www.spc.noaa.gov/exper/sref/ javascript Auto-Refresh 10 min.
http://www.spc.noaa.gov/exper/soundings/ Auto-Refresh 5 min.
http://www.spc.noaa.gov/exper/firecomp/ Auto-Refresh 1 min.
http://www.spc.noaa.gov/climo/ Recent Storm Reports also links to Tornado Statistics Auto-Refresh 5 min.
http://www.spc.noaa.gov/climo/reports/last3hours.html Auto-Refresh 10 min.
http://www.spc.noaa.gov/climo/reports/today.html Auto-Refresh 10 min.
http://www.spc.noaa.gov/climo/reports/yesterday.html Auto-Refresh 10 min.
_
SPC text products from alternate sites
http://kamala.cod.edu/spc/
http://twister.sbs.ohio-state.edu/main.php?pageloc=severe
http://meteora.ucsd.edu/weather/climate/sigmets.current text mixed in
with non-convective SIGMETs
_
http://aviationweather.gov/ or
http://weather.aero/
http://aviationweather.gov/adds/radar/
http://aviationweather.gov/adds/convection/ map Convective
SIGMETs in red
http://aviationweather.gov/adds/airmets/
http://aviationweather.gov/adds/data/airmets/airmets_CB.gif map Convective SIGMETs in red
http://aviationweather.gov/adds/airmets/index.php?CONVECT=on&submitair=1 text Convective
SIGMETs
http://aviationweather.gov/adds/data/airmets/airmets_ALL.gif
http://aviationweather.gov/
http://aviationweather.gov/obs/radar/ National Radar Composite
http://aviationweather.gov/iffdp/
http://aviationweather.gov/iffdp/misc.php
http://aviationweather.gov/data/iffdp/2080.gif Radar Summary
http://aviationweather.gov/iffdp/sigmet.php
http://aviationweather.gov/data/iffdp/6406.txt text Convective
SIGMETs Eastern US (alternative)
http://aviationweather.gov/data/iffdp/6407.txt text Convective
SIGMETs Central US (alternative)
http://aviationweather.gov/data/iffdp/6408.txt text Convective
SIGMETs Western US (alternative)
http://aviationweather.gov/products/cwsu/ Center Weather Advisory (CWA)
http://aviationweather.gov/products/ncwf/ National Convective Weather Forecast (javascript)
http://aviationweather.gov/products/ccfp/ Collaborative Convective Forecast Product (javascript)
_
http://www.caps.ou.edu/ Center for Analysis and Prediction of Storms
http://www.caps.ou.edu/forecasts.htm
http://kkd.ou.edu/fcst_and_analys.htm
http://www.caps.ou.edu/wx/p/r/conus/adas/ US Current
Analyses
http://www.caps.ou.edu/wx/p/r/conus/fcst/ US Forecast
http://cimss.ssec.wisc.edu/snaap/convinit/quicklooks2.php
http://twister.sbs.ohio-state.edu/main.php?pageloc=severe Severe Weather
Indices maps
http://wxmaps.org/pix/forecasts.html
http://wxmaps.org/pix/eta.fcst.html check Vertical
Velocity and Precipitation Forecasts
http://wxmaps.org/pix/avnsr.fcst.html
http://wxmaps.org/pix/avnmr.fcst.html
_
http://www.nws.noaa.gov/mdl/scan/scan_svr_03h.php 0-3 Hour Rainfall and Lightning Forecast check Svr WX probability
http://www.nssl.noaa.gov/modeling.shtml
http://ruc.fsl.noaa.gov/ RUC2 and RUC2-FSL forecast model
http://weather.msfc.nasa.gov/Model/model_conustable0.html (not updating)
http://www.nws.noaa.gov/mdl/forecast/graphics/MAV/index.html GFS (formerly AVN) forecast model
http://www.nws.noaa.gov/mdl/forecast/graphics/MAV/MAVTSVR.TSTM06_000.html 06H Thunderstorm Prob
http://www.nws.noaa.gov/mdl/forecast/graphics/MAV/MAVTSVR.TSTM12_000.html 12H Thunderstorm Prob
http://www.nws.noaa.gov/mdl/forecast/graphics/MAV/MAVTSVR.TSTM24_000.html 24H Thunderstorm Prob
http://www.weather.gov/mdl/forecast/graphics/MAV/MAVTSVR.CSVR06_000.html 06H Cond. Severe Wx Prob
http://www.weather.gov/mdl/forecast/graphics/MAV/MAVTSVR.CSVR12_000.html 12H Cond. Severe Wx Prob
http://www.weather.gov/mdl/forecast/graphics/MAV/MAVTSVR.CSVR24_000.html 24H Cond. Severe Wx Prob
http://www.weather.gov/mdl/forecast/graphics/MAV/MAVTSVR.USVR06_000.html 06H Uncon. Severe Wx Prob
http://www.weather.gov/mdl/forecast/graphics/MAV/MAVTSVR.USVR12_000.html 12H Uncon. Severe Wx Prob
http://www.weather.gov/mdl/forecast/graphics/MAV/MAVTSVR.USVR24_000.html 24H Uncon. Severe Wx Prob
http://www.nws.noaa.gov/mdl/forecast/graphics/MET/index.html NAM (formerly ETA) forecast model
http://www.nws.noaa.gov/mdl/forecast/graphics/MET/METTSVR.TSTM06_000.html 06H Thunderstorm Prob
http://www.nws.noaa.gov/mdl/forecast/graphics/MET/METTSVR.TSTM12_000.html 12H Thunderstorm Prob
http://www.nws.noaa.gov/mdl/forecast/graphics/MET/METTSVR.TSTM24_000.html 24H Thunderstorm Prob
http://www.nws.noaa.gov/mdl/forecast/graphics/MET/METTSVR.CSVR06_000.html 06H Cond. Severe Wx Prob
http://www.nws.noaa.gov/mdl/forecast/graphics/MET/METTSVR.CSVR12_000.html 12H Cond. Severe Wx Prob
http://www.nws.noaa.gov/mdl/forecast/graphics/MET/METTSVR.CSVR24_000.html 24H Cond. Severe Wx Prob
http://www.nws.noaa.gov/mdl/forecast/graphics/MET/METTSVR.USVR06_000.html 06H Uncon. Severe Wx Prob
http://www.nws.noaa.gov/mdl/forecast/graphics/MET/METTSVR.USVR12_000.html 12H Uncon. Severe Wx Prob
http://www.nws.noaa.gov/mdl/forecast/graphics/MET/METTSVR.USVR24_000.html 24H Uncon. Severe Wx Prob
http://www.nws.noaa.gov/mdl/forecast/graphics/MEX/index.html MRF forecast model
http://www.nws.noaa.gov/mdl/forecast/graphics/MEX/MEXTSVR.TSTM12_000.html 12H Thunderstorm Prob
http://www.nws.noaa.gov/mdl/forecast/graphics/MEX/MEXTSVR.TSTM24_000.html 24H Thunderstorm Prob
http://weather.unisys.com/
http://weather.unisys.com/surface/sfc_con_qconv.html
http://weatheroffice.ec.gc.ca/model_forecast/severe_weather_e.html Canada's Severe Weather Charts (available May to June)
GOES
Soundings
_
http://www.star.nesdis.noaa.gov/star/opdb_index.php
http://www.star.nesdis.noaa.gov/smcd/opdb/goes/soundings/
http://www.ssd.noaa.gov/PS/PCPN/pcpn-na.html GOES Sounder Derived Products
http://cimss.ssec.wisc.edu/goes/rt/sounder-dpi.php GOES Derived Product Images (DPI) and Images of GOES
Sounder Bands
http://rammb.cira.colostate.edu/ramsdis/online/sounder.asp
http://weather.msfc.nasa.gov/cgi-bin/sportPublishData.pl?instrument=GESUS&product=COMBCTP
Jetstream
- Upper-Air Analyses & Forecasts
also check hurricane3.htm#RAOB_Soundings
_
http://wxmaps.org/pix/eta.jet.html
http://wxmaps.org/pix/avnsr.jet.html
http://wxmaps.org/pix/avnmr.jet.html
http://aviationweather.gov/adds/winds/
http://aviationweather.gov/products/swh/ select ICAO area A Americas
http://www.spc.noaa.gov/obswx/maps/
http://squall.sfsu.edu/crws/jetstream.html
http://www.rap.ucar.edu/weather/upper/
http://weather.unisys.com/upper_air/
http://vortex.plymouth.edu/upairwx.html
http://vortex.plymouth.edu/upcalc.html
http://vortex.plymouth.edu/upairwx_w.html
http://vortex.plymouth.edu/upcalc_w.html
http://twister.sbs.ohio-state.edu/main.php?pageloc=upperair
http://weather.uwyo.edu/upperair/
http://www.aos.wisc.edu/weatherdata/upperair/
http://hoot.metr.ou.edu/new_upper_air_page.htm
http://weather.cod.edu/upper.html
http://weather.cod.edu/mcupr.frames.html
http://weather.colorado.edu/pages/mainnat.html ?
http://www.accuweather.com/maps-surface.asp?partner=accuweather&traveler=0&type=jet
http://image.weather.com/images/maps/aviation/winds/us_cur_winds_surface_720_en.jpg
http://image.weather.com/images/maps/aviation/av5_720x486.jpg
http://image.weather.com/images/maps/aviation/av10_720x486.jpg
http://image.weather.com/web/maps/aviation/winds/us_cur_winds_18k_720_en.jpg
http://image.weather.com/images/maps/aviation/av34_720x486.jpg
http://image.weather.com/images/maps/aviation/winds/us_fcst_winds_34k_day1_720_en.jpg
http://image.weather.com/images/maps/aviation/winds/us_fcst_winds_34k_day2_720_en.jpg
http://image.weather.com/images/maps/aviation/jet1_720x486.jpg
http://image.weather.com/images/maps/aviation/jet2_720x486.jpg
http://image.weather.com/images/maps/aviation/jet3_720x486.jpg
http://image.weather.com/images/maps/aviation/jet4_720x486.jpg
http://image.weather.com/images/maps/aviation/jet5_720x486.jpg
http://image.weather.com/images/maps/aviation/jet6_720x486.jpg
http://image.weather.com/images/maps/aviation/jet7_720x486.jpg
http://www.intellicast.com/IcastPage/LoadPage.aspx?loc=usa&seg=LocalWeather&prodgrp=SurfaceMaps&product=JetStream (cookie)
http://www.intellicast.com/IcastPage/LoadPage.aspx?loc=usa&seg=LocalWeather&prodgrp=SurfaceMaps&product=300mb (cookie)
http://www.intellicast.com/IcastPage/LoadPage.aspx?loc=usa&seg=LocalWeather&prodgrp=SurfaceMaps&product=500mb (cookie)
http://www.intellicast.com/IcastPage/LoadPage.aspx?loc=usa&seg=LocalWeather&prodgrp=SurfaceMaps&product=850mb (cookie)
http://www.wunderground.com/US/Region/US/JetStream.html
http://icons.wunderground.com/data/640x480/us_jt_anim.gif
http://icons.wunderground.com/data/640x480/2xus_jt.gif
http://icons.wunderground.com/data/images/us_jt.gif
http://www.stormchaser.niu.edu/machine/upcontour.html
http://www.ametsoc.org/dstreme/images/ua_300w.gif
http://www.ametsoc.org/dstreme/images/ua_500.gif
http://www.ametsoc.org/dstreme/images/ua_700.gif
http://www.ametsoc.org/dstreme/images/ua_850.gif
http://www.weatherbank.com/free/grafx/jsnh.gif
_
http://www.ssd.noaa.gov/PS/WIND/hdw-table.html
http://www.star.nesdis.noaa.gov/smcd/opdb/goes/winds/
http://www.arl.noaa.gov/ready/sonde.html
http://www.arl.noaa.gov/ready-bin/gempakobs.pl?gempakproduct=Decoded+Upper-air+Observations
http://aviationweather.gov/products/nws/fdwinds/ Winds and
Temperatures Aloft text-only
http://weather.noaa.gov/pub/SL.us008001/DF.an/DC.vsndn/ raw text data
http://meteora.ucsd.edu/weather/observations/upperair/ raw text data
http://raob.fsl.noaa.gov/ Radiosonde Database Upper Air Skew and
Text
http://weather.cod.edu/analysis/analysis.raob.html
http://www.aos.wisc.edu/weather/content/soundings/
http://www.nrlmry.navy.mil/aerosol/raobs_world.html World RAOBS
Storm News
_
also check government Office of Emergency Management
http://weather.yahoo.com/
http://www.usatoday.com/weather/digest.htm
http://www.weather.com/newscenter/
http://www.accuweather.com/news-center.asp
http://www.cnn.com/WEATHER/
http://www.palmbeachpost.com/news/content/shared/weather/ap/ap_headlines.html (requires cookies)
or http://www.palmbeachdailynews.com/news/content/shared/weather/ap/ap_headlines.html (requires cookies)
http://www.nws.noaa.gov/ and http://www.nws.noaa.gov/pa/
Storm
Reports
_
http://www.spc.noaa.gov/climo/ Auto-Refresh 5 min. SPC Tornado and Severe Thunderstorm
Reports and Tornado Statistics
http://moe.met.fsu.edu/~acevans/reports/ SPC Local Storm
Report Maps
http://kamala.cod.edu/spc/latest.nwus22.KWNS.html - http://vortex.plymouth.edu/cgi-bin/wwus60 - http://weather.cod.edu/digatmos/spc/
http://www.met.tamu.edu/weather/warnings/reports.html SPC text products
and Local Storm Reports
http://weather.noaa.gov/pub/data/raw/nw/?C=M;O=D SPC text products
and Local Storm Reports
http://weather.noaa.gov/pub/SL.us008001/DF.c5/DC.textf/DS.lsrnw/?C=M;O=D Local Storm
Reports
http://www.weathermatrix.net/archive/spclog/date.html#end archived SPC
Tornado and Severe Thunderstorm Reports
http://www.weather.gov/view/national.php?prod=PNS&sid=???
http://kamala.cod.edu/ click on State
then click on Local Storm Reports
http://www.weathermatrix.net/archive/lsr/date.html#end archived Local
Storm Reports
http://weather.noaa.gov/pub/data/observations/storm_rpt/
http://www.weather.brockport.edu/cgi-bin/storm?station=@fl&time=Today Replace @fl with
your 2-letter State ID or airport code
http://www.weather.brockport.edu/cgi-bin/storm?station=@fl&time=Yesterday Replace @fl with
your 2-letter State ID or airport code
http://www.weatherwatchers.org/archive/stormreports/
or http://www.weathermatrix.org/archive/stormreports/
or http://www.weathermatrix.net/archive/stormreports/
or http://www.weathermatrix.com/archive/stormreports/
or http://www.cybervox.org/archive/stormreports/
http://image.weather.com/images/maps/special/svr_damage1_720x486.jpg
http://image.weather.com/images/maps/special/svr_damage2_720x486.jpg
http://image.weather.com/images/maps/special/svr_damage3_720x486.jpg
http://image.weather.com/images/maps/special/svr_damage4_720x486.jpg
Record
Events
_
http://www.weather.gov/view/national.php?prod=RER
http://weather.noaa.gov/pub/data/raw/sx/?C=M;O=D sxus??.????.rer.???.txt
http://twister.sbs.ohio-state.edu/public/record/?C=M;O=D
http://www.weathermatrix.net/archive/usrecords/date.html#end
http://weather.noaa.gov/pub/data/records/ missing a few
states
http://www.ocs.orst.edu/pub_ftp/weather/observations/records/US/ West US
http://image.weather.com/images/maps/special/record_event_1_720x486.jpg
http://image.weather.com/images/maps/special/record_event_2_720x486.jpg
http://image.weather.com/images/maps/special/record_hi_1_720x486.jpg
http://image.weather.com/images/maps/special/record_hi_2_720x486.jpg
http://image.weather.com/images/maps/special/record_los_1_720x486.jpg
http://image.weather.com/images/maps/special/record_los_2_720x486.jpg
_
http://www.cpc.ncep.noaa.gov/products/analysis_monitoring/cdus/prcp_temp_tables/ Past US Data
Summary Files
http://www.cip.ogp.noaa.gov/ Climate Information Program
http://www.ncdc.noaa.gov/ National Climatic Data Center
http://www.ncdc.noaa.gov/oa/climate/climatedata.html
http://www.ncdc.noaa.gov/oa/climate/research/2004/perspectives.html replace 2004 with past year
http://www.ncdc.noaa.gov/oa/climate/stateclimatologists.html
http://www.ncdc.noaa.gov/ol/climate/severeweather/extremes.html
http://www4.ncdc.noaa.gov/cgi-win/wwcgi.dll?wwEvent~Storms
http://www.photolib.noaa.gov/
Storm - Flood - Surface Weather Analyses &
Forecasts Maps
_
http://www.weather.gov/forecasts/graphical/sectors/conus.php?element=Wx
http://www.hpc.ncep.noaa.gov/
http://www.hpc.ncep.noaa.gov/html/sfc2.shtml or http://www.hpc.ncep.noaa.gov/html/sfctxt.html Surface Analyses every 3 hours
http://www.hpc.ncep.noaa.gov/html/sfcloop/usrad_animate.gif
http://www.hpc.ncep.noaa.gov/html/sfcloop/ussat_animate.gif
http://www.hpc.ncep.noaa.gov/noaa/noaa.gif Today's Forecast
http://www.hpc.ncep.noaa.gov/basicwx/allfcsts_loop_wbg.gif
http://www.hpc.ncep.noaa.gov/basicwx/basic_sfcjpg.shtml Short Range Forecasts (Days 1 & 2)
or http://www.hpc.ncep.noaa.gov/basicwx/basicwx.shtml
or http://www.hpc.ncep.noaa.gov/basicwx/basicwxnew.html
or http://www.hpc.ncep.noaa.gov/basicwx/basicwx.html
or http://www.hpc.ncep.noaa.gov/html/fcsttxt.html
http://www.hpc.ncep.noaa.gov/medr/medr.shtml Medium Range Forecasts (Days 3-7)
http://www.hpc.ncep.noaa.gov/qpf/excess_rain.shtml Excessive Rainfall Forecasts
http://www.hpc.ncep.noaa.gov/qpf/qpftxt.html Quantitative Precipitation and Snow Forecasts
http://www.hpc.ncep.noaa.gov/qpf/qpf2.shtml Day 1 Quantitative Precipitation Forecasts
http://www.hpc.ncep.noaa.gov/qpf/day2.shtml Day 2 Quantitative Precipitation Forecasts
http://www.hpc.ncep.noaa.gov/qpf/day3.shtml Day 3 Quantitative Precipitation Forecasts
http://www.hpc.ncep.noaa.gov/qpf/day1-2.shtml Day 1-2 Quantitative Precipitation Forecasts
http://www.hpc.ncep.noaa.gov/qpf/day1-3.shtml Day 1-3 Quantitative Precipitation Forecasts
http://www.hpc.ncep.noaa.gov/qpf/day45.html Day 4-5 Quantitative Precipitation Forecasts
http://www.hpc.ncep.noaa.gov/qpf/qpf_12hr.shtml 12-Hour Quantitative Precipitation Forecasts
http://www.hpc.ncep.noaa.gov/qpf/6hrqpfall.html Six-Hourly QPF Forecasts
http://www.hpc.ncep.noaa.gov/qpf/d1qpfall.html Day 1 QPF Forecasts
http://www.hpc.ncep.noaa.gov/qpf/d2qpfall.html Day 2 QPF Forecasts
http://www.hpc.ncep.noaa.gov/qpf/24hrqpfall.html Days 1-5 QPF Forecasts
http://www.hpc.ncep.noaa.gov/html/exp2.shtml or http://www.hpc.ncep.noaa.gov/html/exptxt.html Experimental products
http://www.hpc.ncep.noaa.gov/sfc/?M=D
http://www.hpc.ncep.noaa.gov/basicwx/?M=D
http://www.hpc.ncep.noaa.gov/qpf/?M=D
http://www.opc.ncep.noaa.gov/UA.shtml N Hemispheric Surface Analysis
http://www.opc.ncep.noaa.gov/Loops/
http://www.cpc.ncep.noaa.gov/
http://www.cpc.ncep.noaa.gov/products/predictions/ Long Range Predictions
http://www.cpc.ncep.noaa.gov/products/predictions/threats/threats.php Weather Threats
http://www.cpc.ncep.noaa.gov/products/predictions/610day/
http://www.cpc.ncep.noaa.gov/products/predictions/814day/
http://www.cpc.ncep.noaa.gov/products/predictions/30day/
http://www.cpc.ncep.noaa.gov/products/predictions/90day/
http://www.cpc.ncep.noaa.gov/products/predictions/multi_season/
http://www.cpc.ncep.noaa.gov/products/expert_assessment/ Past weekly-monthly
precip. and temperature
http://www.cpc.ncep.noaa.gov/products/analysis_monitoring/regional_monitoring/usa.shtml
http://www.cpc.ncep.noaa.gov/pacdir/NFORdir/HOME3.shtml Probability of
Exceedance Outlook
http://kamala.cod.edu/HPC/
http://asp1.sbs.ohio-state.edu/text/station/KWNO/?C=N;O=A
http://www.ncdc.noaa.gov/oa/climate/research/monitoring.html Climate Monitoring
http://weatheroffice.ec.gc.ca/analysis/index_e.html Canada
_
http://aviationweather.gov/products/swl/
http://www.rap.ucar.edu/weather/surface.html
https://avweb.weather.navy.mil/aviation/html/decoded.shtml?SYS (Censored)
https://afweather.afwa.af.mil/weather/local_weather/local_weather.html
http://www.unidata.ucar.edu/software/gempak/examples/redbook/listgifs.php
http://weather.unisys.com/surface/
http://twister.sbs.ohio-state.edu/main.php?pageloc=surface
http://www.caps.ou.edu/wx/p/r/conus/adas/
http://cumulus.geol.iastate.edu/sfc.html
http://weather.uwyo.edu/surface/
http://www.mankato.msus.edu/weather/current/current_wx.html
http://www.mankato.msus.edu/weather/current/surface_analysis.html
http://cimss.ssec.wisc.edu/model/daily/daily.html
http://image.weather.com/images/maps/current/curwx_720x486.jpg
http://image.weather.com/images/maps/schoolday/schoolday_wx_720x486.jpg
http://image.weather.com/images/maps/travel/trvlrain_720x486.jpg
http://image.weather.com/images/maps/travel/trvlrain2_720x486.jpg
http://image.weather.com/images/maps/forecast/midfcst_720x486.jpg Midday Forecast
http://image.weather.com/images/maps/forecast/pmfcst_720x486.jpg Early Evening Forecast
http://image.weather.com/images/maps/forecast/amfcst_720x486.jpg Morning Forecast
http://image.weather.com/images/maps/forecast/fore1_720x486.jpg Monday's Forecast
http://image.weather.com/images/maps/forecast/fore2_720x486.jpg Tuesday's Forecast
http://image.weather.com/images/maps/forecast/fore3_720x486.jpg Wednesday's Forecast
http://image.weather.com/images/maps/forecast/fore4_720x486.jpg Thursday's Forecast
http://image.weather.com/images/maps/forecast/fore5_720x486.jpg Friday's Forecast
http://image.weather.com/images/maps/forecast/trend6_720x486.jpg Saturday's Forecast
http://image.weather.com/images/maps/forecast/trend7_720x486.jpg Sunday's Forecast
http://www.intellicast.com/IcastPage/LoadPage.aspx?loc=usa&seg=LocalWeather&prodgrp=SurfaceMaps&product=SurfaceAnalysis (cookie)
http://www.intellicast.com/IcastPage/LoadPage.aspx?loc=usa&seg=LocalWeather&prodgrp=SurfaceMaps&product=ForecastToday (cookie)
http://www.intellicast.com/IcastPage/LoadPage.aspx?loc=usa&seg=LocalWeather&prodgrp=SurfaceMaps&product=ForecastTomorrow (cookie)
http://www.intellicast.com/IcastPage/LoadPage.aspx?loc=usa&seg=LocalWeather&prodgrp=SurfaceMaps&product=24Hour (cookie)
http://www.intellicast.com/IcastPage/LoadPage.aspx?loc=usa&seg=LocalWeather&prodgrp=SurfaceMaps&product=48Hour (cookie)
http://www.intellicast.com/IcastPage/LoadPage.aspx?loc=usa&seg=LocalWeather&prodgrp=SurfaceMaps&product=72Hour (cookie)
Travel Brief
_
http://www.hpc.ncep.noaa.gov/discussions/selcit.shtml
http://www.weather.gov/xml/tpex/scs.php SELECTED CITIES WEATHER SUMMARY AND
FORECASTS & NATIONAL TEMPERATURE EXTREMES
http://www.hpc.ncep.noaa.gov/discussions/tav.html TRAVELERS
FORECAST TABLE
http://www.weather.gov/view/national.php?prodtype=tempprecip
http://www.weather.gov/view/national.php?prodtype=traveler
http://weather.noaa.gov/pub/data/raw/fp/fpus20.kwnh.scs.11.txt - http://weather.noaa.gov/pub/data/raw/fp/fpus21.kwnh.scs.12.txt - http://weather.noaa.gov/pub/data/raw/fp/fpus22.kwnh.scs.13.txt - http://weather.noaa.gov/pub/data/raw/fp/fpus23.kwnh.scs.14.txt
http://weather.noaa.gov/pub/data/raw/fp/fpus10.kwnh.tav.10.txt - http://weather.noaa.gov/pub/data/raw/fp/fpus12.kwnh.tav.12.txt - http://weather.noaa.gov/pub/data/raw/fp/fpus13.kwnh.tav.13.txt
http://weather.noaa.gov/pub/data/raw/ab/abus23.kwbc.tpt.wrn.txt TEMPERATURE/WEATHER
FOR WESTERN UNITED STATES
http://weather.noaa.gov/pub/data/raw/ab/abus24.kwbc.tpt.ern.txt TEMPERATURE/WEATHER
FOR EASTERN UNITED STATES
http://weather.noaa.gov/pub/data/raw/ab/abus25.kwbc.tpt.crn.txt TEMPERATURE/WEATHER
FOR CENTRAL UNITED STATES
http://weather.noaa.gov/pub/data/raw/ab/abna26.kwbc.tpt.nam.txt TEMPERATURE/WEATHER
FOR INTERNATIONAL CITIES
http://weather.noaa.gov/pub/data/raw/ab/abcn01.kwbc.tpt.can.txt CANADIAN
TEMPERATURE AND PRECIPITATION TABLE
http://twister.sbs.ohio-state.edu/canada/?C=M;O=D
http://weather.noaa.gov/pub/data/raw/ab/abxx07.kwbc.tpt.lat.txt LATIN AMERICAN
TEMP AND WEATHER TABLE
http://weather.noaa.gov/pub/data/raw/ab/abxx06.kwbc.tpt.int.txt FOREIGN
TEMPERATURE AND WEATHER TABLE
http://www.weather.com/activities/travel/
http://www.intellicast.com/Travel/
http://www.accuweather.com/us-city-list.asp
Fax Charts
_
http://weather.noaa.gov/fax/ Weather charts in
TIFF format.
http://weather.noaa.gov/fax/nwsfax.html NWS charts in
TIFF format.
http://weather.noaa.gov/fax/marsh.shtml Marine - Atlantic
charts in TIFF format.
http://weather.noaa.gov/fax/gulf.shtml Marine - Gulf of
Mexico charts in TIFF format.
http://weather.noaa.gov/fax/internl.shtml
http://weather.noaa.gov/fax/wafsfax.shtml
http://weather.noaa.gov/fax/wefaxe.shtml
http://weather.noaa.gov/fax/otherfax.shtml
http://weather.noaa.gov/pub/fax/?C=M;O=D
http://weather.noaa.gov/pub/fax/Areadme_first.html
http://weather.noaa.gov/pub/fax/Amaster_index.html
U.S.
Analyses Graphics
_
http://www.nowcoast.noaa.gov/ [requires javascript and java]
http://www.hpc.ncep.noaa.gov/html/sfc2.shtml or http://www.hpc.ncep.noaa.gov/html/sfctxt.html
Analysis Times 00Z 03Z 06Z 09Z 12Z 15Z 18Z 21Z posted about 2
hours later
http://www.hpc.ncep.noaa.gov/sfc/satsfc.gif Analysis/Satellite Composite (N Amer/Pacific)
http://www.hpc.ncep.noaa.gov/sfc/satsfcnps.gif Analysis/Satellite Composite (North America)
http://www.hpc.ncep.noaa.gov/sfc/90fwbg.gif North America / With Surface Observations - small
http://www.hpc.ncep.noaa.gov/sfc/newnamsfc.gif North America/ With Surface Observations - small
http://www.hpc.ncep.noaa.gov/sfc/lrgnamsfcwbg.gif North America / With Surface Observations - large
http://www.hpc.ncep.noaa.gov/sfc/namfntsfcwbg.gif North America / Without Surface Observations
http://www.hpc.ncep.noaa.gov/sfc/QYAA00.tiff Fax Chart
http://www.hpc.ncep.noaa.gov/sfc/ussatsfc.gif Analysis/Satellite Composite (CONUS)
http://www.hpc.ncep.noaa.gov/sfc/radsfcus.gif Analysis/Radar Composite (CONUS)
http://www.hpc.ncep.noaa.gov/sfc/namussfcwbg.gif Continental U.S. (CONUS) / With Surface Observations
http://www.hpc.ncep.noaa.gov/sfc/awc90f.gif Continental U.S. (CONUS) / With Surface Observations
http://www.hpc.ncep.noaa.gov/sfc/bwsfc.gif United States (CONUS/color background)
http://www.hpc.ncep.noaa.gov/sfc/usfntsfcwbg.gif Continental U.S. (CONUS) / Without Surface Observations
or http://www.hpc.ncep.noaa.gov/sfc/loopimagesfcwbg.gif Continental U.S. (CONUS) / Without Surface Observations
http://www.hpc.ncep.noaa.gov/sfc/sfcobs/small_latestsfc.gif Hourly Surface Observations over the Continental U.S. -
small
http://www.hpc.ncep.noaa.gov/sfc/sfcobs/large_latestsfc.gif Hourly Surface Observations over the Continental U.S. -
large
http://www.hpc.ncep.noaa.gov/sfc/namnesfcwbg.gif Eastern U.S. (North)
http://www.hpc.ncep.noaa.gov/sfc/namcesfcwbg.gif Eastern U.S. (Central
http://www.hpc.ncep.noaa.gov/sfc/namsesfcwbg.gif Eastern U.S. (South)
http://www.hpc.ncep.noaa.gov/sfc/namncsfcwbg.gif Central U.S. (North)
http://www.hpc.ncep.noaa.gov/sfc/namccsfcwbg.gif Central U.S. (Central)
http://www.hpc.ncep.noaa.gov/sfc/namscsfcwbg.gif Central U.S. (South)
http://www.hpc.ncep.noaa.gov/sfc/namnwsfcwbg.gif Western U.S. (North)
http://www.hpc.ncep.noaa.gov/sfc/namcwsfcwbg.gif Western U.S. (Central)
http://www.hpc.ncep.noaa.gov/sfc/namswsfcwbg.gif Western U.S. (South)
http://www.hpc.ncep.noaa.gov/sfc/namaksfcwbg.gif Alaska
http://www.hpc.ncep.noaa.gov/sfc/namak2sfcwbg.gif Gulf of Alaska
_
http://www.spc.noaa.gov/
http://www.spc.noaa.gov/exper/
http://www.spc.noaa.gov/products/exper/enhtstm/
http://www.spc.noaa.gov/compmap/ javascript
http://www.cdc.noaa.gov/map/wx/current.shtml
http://www.cdc.noaa.gov/cgi-bin/PublicData/getpage.pl
http://www-frd.fsl.noaa.gov/fsl/wx/anal.cgi
http://ruc.fsl.noaa.gov/ select RUC
http://www-sdd.fsl.noaa.gov/MSAS/msas_analyses.html
http://www.nws.noaa.gov/mdl/lamp/lamp_analysis.shtml
http://www.caps.ou.edu/wx/p/r/conus/adas/
http://moe.met.fsu.edu/automet2/
http://www.coolwx.com/analysis/
Precipitation - Rainfall Forecasts &
Analyses
_
http://www.weather.gov/forecasts/graphical/sectors/conus.php?element=PoP12
http://www.weather.gov/forecasts/graphical/sectors/conus.php?element=QPF
http://www.hpc.ncep.noaa.gov/qpf/excess_rain.shtml Excessive Rainfall Forecasts
http://www.hpc.ncep.noaa.gov/qpf/qpftxt.html Quantitative Precipitation and Snow Forecasts
http://www.hpc.ncep.noaa.gov/qpf/qpf2.shtml Day 1 Quantitative Precipitation Forecasts
http://www.hpc.ncep.noaa.gov/qpf/day2.shtml Day 2 Quantitative Precipitation Forecasts
http://www.hpc.ncep.noaa.gov/qpf/day3.shtml Day 3 Quantitative Precipitation Forecasts
http://www.hpc.ncep.noaa.gov/qpf/day1-2.shtml Day 1-2 Quantitative Precipitation Forecasts
http://www.hpc.ncep.noaa.gov/qpf/day1-3.shtml Day 1-3 Quantitative Precipitation Forecasts
http://www.hpc.ncep.noaa.gov/qpf/day45.html Day 4-5 Quantitative Precipitation Forecasts
http://www.hpc.ncep.noaa.gov/qpf/qpf_12hr.shtml 12-Hour Quantitative Precipitation Forecasts
http://www.hpc.ncep.noaa.gov/qpf/6hrqpfall.html Six-Hourly QPF Forecasts
http://www.hpc.ncep.noaa.gov/qpf/d1qpfall.html Day 1 QPF Forecasts
http://www.hpc.ncep.noaa.gov/qpf/d1qpfall.html Day 2 QPF Forecasts
http://www.hpc.ncep.noaa.gov/qpf/24hrqpfall.html Days 1-5 QPF Forecasts
http://www.hpc.ncep.noaa.gov/qpfci/qpfci.shtml QPF Confidence
Forecasts
http://www.hpc.ncep.noaa.gov/medr/medr.shtml or http://www.hpc.ncep.noaa.gov/html/fcsttxt.html#mediumrange
http://www.hpc.ncep.noaa.gov/html/discuss.shtml or http://www.hpc.ncep.noaa.gov/html/fcsttxt.html#discussions
http://www.hpc.ncep.noaa.gov/wwd/winter_wx.shtml
http://www.hpc.ncep.noaa.gov/newrpp/rpp_ens.shtml Probabilistic
Flash Flood Guidance
http://www.nws.noaa.gov/mdl/scan/scan_svr_03h.php 0-3 Hour Rainfall,
Lightning and Severe Weather Forecasts
http://www.nws.noaa.gov/mdl/lampq/qpf.shtml 1-2, 4-7, 10-16
Hour Rainfall Forecast
http://www.earthsat.com/wx/flooding/ffgusa.gif FloodThreat Map
http://www.earthsat.com/wx/flooding/riskusa.gif FloodRisk Map
http://www.earthsat.com/wx/flooding/qpfusa.gif Precip. Forecast
Map
http://www.srh.noaa.gov/default1.html QPF products from
River Forecast Centers
http://ruc.fsl.noaa.gov/ select RUC
http://wwwghcc.msfc.nasa.gov/Model/model_mm5ensembletable0.html Ensemble MM5
http://www.nws.noaa.gov/mdl/forecast/graphics/MAV/ GFS (formerly AVN)
http://www.nws.noaa.gov/mdl/forecast/graphics/MAV/MAV.POPOH_000.html 01H PoPO
http://www.nws.noaa.gov/mdl/forecast/graphics/MAV/MAV.POPOP03_000.html 03H PoPO
http://www.nws.noaa.gov/mdl/forecast/graphics/MAV/MAV.POP06_000.html 06H PoP
http://www.nws.noaa.gov/mdl/forecast/graphics/MAV/MAV.BQPF06_000.html 06H QPF (Best Cat.)
http://www.nws.noaa.gov/mdl/forecast/graphics/MAV/MAV.PQPF206_000.html 06H Prob. >= 0.10 in.
http://www.nws.noaa.gov/mdl/forecast/graphics/MAV/MAV.PQPF306_000.html 06H Prob. >= 0.25 in.
http://www.nws.noaa.gov/mdl/forecast/graphics/MAV/MAV.PQPF406_000.html 06H Prob. >= 0.50 in.
http://www.nws.noaa.gov/mdl/forecast/graphics/MAV/MAV.PQPF506_000.html 06H Prob. >= 1.00 in.
http://www.nws.noaa.gov/mdl/forecast/graphics/MAV/MAV.POP12_000.html 12H PoP
http://www.nws.noaa.gov/mdl/forecast/graphics/MAV/MAV.BQPF12_000.html 12H QPF (Best Cat.)
http://www.nws.noaa.gov/mdl/forecast/graphics/MAV/MAV.PQPF212_000.html 12H Prob. >= 0.10 in.
http://www.nws.noaa.gov/mdl/forecast/graphics/MAV/MAV.PQPF312_000.html 12H Prob. >= 0.25 in.
http://www.nws.noaa.gov/mdl/forecast/graphics/MAV/MAV.PQPF412_000.html 12H Prob. >= 0.50 in.
http://www.nws.noaa.gov/mdl/forecast/graphics/MAV/MAV.PQPF512_000.html 12H Prob. >= 1.00 in.
http://www.nws.noaa.gov/mdl/forecast/graphics/MAV/MAV.PQPF612_000.html 12H Prob. >= 2.00 in.
http://www.nws.noaa.gov/mdl/forecast/graphics/MAV/MAV.POP24_000.html 24H PoP
http://www.nws.noaa.gov/mdl/forecast/graphics/MAV/MAV.BQPF24_000.html 24H QPF (Best Cat.)
http://www.nws.noaa.gov/mdl/forecast/graphics/MAV/MAV.PQPF224_000.html 24H Prob. >= 0.10 in.
http://www.nws.noaa.gov/mdl/forecast/graphics/MAV/MAV.PQPF324_000.html 24H Prob. >= 0.25 in.
http://www.nws.noaa.gov/mdl/forecast/graphics/MAV/MAV.PQPF424_000.html 24H Prob. >= 0.50 in.
http://www.nws.noaa.gov/mdl/forecast/graphics/MAV/MAV.PQPF524_000.html 24H Prob. >= 1.00 in.
http://www.nws.noaa.gov/mdl/forecast/graphics/MAV/MAV.PQPF624_000.html 24H Prob. >= 2.00 in.
http://www.nws.noaa.gov/mdl/forecast/graphics/MAV/MAV.BPCHR_000.html Precip. Characteristics
http://www.nws.noaa.gov/mdl/forecast/graphics/MAV/MAV.CPDRZ_000.html Cond. Prob. of Drizzle
http://www.nws.noaa.gov/mdl/forecast/graphics/MAV/MAV.CPSTY_000.html Cond. Prob. of Steady Precip
http://www.nws.noaa.gov/mdl/forecast/graphics/MAV/MAV.CPSHW_000.html Cond. Prob. of Showers
http://www.nws.noaa.gov/mdl/forecast/graphics/MET/ NAM (formerly ETA)
http://www.nws.noaa.gov/mdl/forecast/graphics/MET/MET.POP06_000.html 06H PoP
http://www.nws.noaa.gov/mdl/forecast/graphics/MET/MET.BQPF06_000.html 06H QPF (Best Cat.)
http://www.nws.noaa.gov/mdl/forecast/graphics/MET/MET.PQPF206_000.html 06H Prob. >= 0.10 in.
http://www.nws.noaa.gov/mdl/forecast/graphics/MET/MET.PQPF306_000.html 06H Prob. >= 0.25 in.
http://www.nws.noaa.gov/mdl/forecast/graphics/MET/MET.PQPF406_000.html 06H Prob. >= 0.50 in.
http://www.nws.noaa.gov/mdl/forecast/graphics/MET/MET.PQPF506_000.html 06H Prob. >= 1.00 in.
http://www.nws.noaa.gov/mdl/forecast/graphics/MET/MET.POP12_000.html 12H PoP
http://www.nws.noaa.gov/mdl/forecast/graphics/MET/MET.BQPF12_000.html 12H QPF (Best Cat.)
http://www.nws.noaa.gov/mdl/forecast/graphics/MET/MET.PQPF212_000.html 12H Prob. >= 0.10 in.
http://www.nws.noaa.gov/mdl/forecast/graphics/MET/MET.PQPF312_000.html 12H Prob. >= 0.25 in.
http://www.nws.noaa.gov/mdl/forecast/graphics/MET/MET.PQPF412_000.html 12H Prob. >= 0.50 in.
http://www.nws.noaa.gov/mdl/forecast/graphics/MET/MET.PQPF512_000.html 12H Prob. >= 1.00 in.
http://www.nws.noaa.gov/mdl/forecast/graphics/MET/MET.PQPF612_000.html 12H Prob. >= 2.00 in.
http://www.nws.noaa.gov/mdl/forecast/graphics/MET/MET.POP24_000.html 24H PoP
http://www.nws.noaa.gov/mdl/forecast/graphics/MET/MET.BQPF24_000.html 24H QPF (Best Cat.)
http://www.nws.noaa.gov/mdl/forecast/graphics/MET/MET.PQPF224_000.html 24H Prob. >= 0.10 in.
http://www.nws.noaa.gov/mdl/forecast/graphics/MET/MET.PQPF324_000.html 24H Prob. >= 0.25 in.
http://www.nws.noaa.gov/mdl/forecast/graphics/MET/MET.PQPF424_000.html 24H Prob. >= 0.50 in.
http://www.nws.noaa.gov/mdl/forecast/graphics/MET/MET.PQPF524_000.html 24H Prob. >= 1.00 in.
http://www.nws.noaa.gov/mdl/forecast/graphics/MET/MET.PQPF624_000.html 24H Prob. >= 2.00 in.
http://www.nws.noaa.gov/mdl/forecast/graphics/MEX/ GFS MRF
http://www.nws.noaa.gov/mdl/forecast/graphics/MEX/MEX.POP12_000.html 12H PoP
http://www.nws.noaa.gov/mdl/forecast/graphics/MEX/MEX.BQPF12_000.html 12H QPF (Best Cat.)
http://www.nws.noaa.gov/mdl/forecast/graphics/MEX/MEX.PQPF212_000.html 12H Prob. >= 0.10 in.
http://www.nws.noaa.gov/mdl/forecast/graphics/MEX/MEX.PQPF312_000.html 12H Prob. >= 0.25 in.
http://www.nws.noaa.gov/mdl/forecast/graphics/MEX/MEX.PQPF412_000.html 12H Prob. >= 0.50 in.
http://www.nws.noaa.gov/mdl/forecast/graphics/MEX/MEX.PQPF512_000.html 12H Prob. >= 1.00 in.
http://www.nws.noaa.gov/mdl/forecast/graphics/MEX/MEX.PQPF612_000.html 12H Prob. >= 2.00 in.
http://www.nws.noaa.gov/mdl/forecast/graphics/MEX/MEX.POP24_000.html 24H PoP
http://www.nws.noaa.gov/mdl/forecast/graphics/MEX/MEX.BQPF24_000.html 24H QPF (Best Cat.)
http://www.nws.noaa.gov/mdl/forecast/graphics/MEX/MEX.PQPF224_000.html 24H Prob. >= 0.10 in.
http://www.nws.noaa.gov/mdl/forecast/graphics/MEX/MEX.PQPF324_000.html 24H Prob. >= 0.25 in.
http://www.nws.noaa.gov/mdl/forecast/graphics/MEX/MEX.PQPF424_000.html 24H Prob. >= 0.50 in.
http://www.nws.noaa.gov/mdl/forecast/graphics/MEX/MEX.PQPF524_000.html 24H Prob. >= 1.00 in.
http://www.nws.noaa.gov/mdl/forecast/graphics/MEX/MEX.PQPF624_000.html 24H Prob. >= 2.00 in.
http://www.nws.noaa.gov/mdl/forecast/graphics/MEX/MEX.PQPF724_000.html 24H Prob. >= 3.00 in.
http://wxmaps.org/pix/prec1.html 10-Day Precipitation Outlook
http://www.cpc.ncep.noaa.gov/pacdir/NFORdir/jo2.html Probability of
Precipitation Exceedance
http://www.nws.noaa.gov/oh/hic/conds.html Daily Hydrologic
Conditions
http://www.weather.gov/view/national.php?prod=FFW
http://www.weather.gov/view/national.php?prod=FLW
http://www.weather.gov/view/national.php?prod=FLS
http://www.weather.gov/view/national.php?prod=FLN
http://www.weather.gov/view/national.php?prod=QPF&sid=ERD
http://www.nws.noaa.gov/oh/hic/current/fln/fln_sum.shtml (alternative)
http://wwwagwx.ca.uky.edu/public/WSHFLNNMC (alternative)
http://www.accuweather.com/maps-precipitation.asp
http://image.weather.com/images/maps/special/record_rain_1_720x486.jpg
http://image.weather.com/images/maps/special/record_rain_2_720x486.jpg
http://image.weather.com/images/maps/travel/trvlrain_720x486.jpg
http://image.weather.com/images/maps/travel/trvlrain2_720x486.jpg
http://image.weather.com/images/maps/special/30Day_Precip_720x486.jpg
http://image.weather.com/images/maps/special/90Day_Precip_720x486.jpg
http://www.nws.noaa.gov/om/water/index.shtml Guides
http://www.noaa.gov/floods.html
Accumulated Precipitation Estimates
_
http://www.srh.noaa.gov/default1.html River Forecast Centers
http://www.srh.noaa.gov/alr/qpfvsmap.shtml SouthEast region
Totals
http://www.rap.ucar.edu/weather/surface/
http://www.rap.ucar.edu/weather/surface/us_precip.gif 24 hr from 12Z
http://www.cpc.noaa.gov/products/precip/realtime/GIS/USMEX/USMEX-precip.shtml
http://www.cpc.ncep.noaa.gov/products/analysis_monitoring/regional_monitoring/us_weekly_precip.shtml
http://www.cpc.ncep.noaa.gov/products/analysis_monitoring/regional_monitoring/usa.shtml weekly monthly
http://weather.noaa.gov/pub/fax/QETA00.TIF 24 HR Precipitation Amounts
http://precip.fsl.noaa.gov/hourly_precip.html javascript/java last 24 hours
http://nmq.ou.edu/ QPE Products/Accumulations
http://www.agriculture.com/data/agol/fnw/free/dailypre.gif daily
http://www.agriculture.com/data/agol/fnw/free/dailyacc.gif since 6AM CDT
http://wwwagwx.ca.uky.edu/ldm-images/24_rain.gif
Precipitation Forecast Verification
http://www.hpc.ncep.noaa.gov/npvu/index.shtml or http://www.hpc.ncep.noaa.gov/npvu/sitemap2.shtml
http://wwwt.emc.ncep.noaa.gov/mmb/ylin/pcpanl/
http://www.nssl.noaa.gov/etakf/qpfplots/
Radar Accumulated
Precipitation Estimates
http://www.intellicast.com/IcastPage/LoadPage.aspx?loc=usa&seg=LocalWeather&prodgrp=HistoricWeather&product=Precipitation (cookie) 24 hr from 12Z
http://www.intellicast.com/IcastPage/LoadPage.aspx?loc=usa&seg=LocalWeather&prodgrp=HistoricWeather&product=WeeklyPrecipitation (cookie) weekly from 12Z
http://radar.accuweather.com/adcbin/public/radar_index_large.asp?getArea=US_REG&nxtype=op
1 hr
http://sirocco.accuweather.com/nx_mosaic_640x480c/op/inmopus_.gif
http://radar.accuweather.com/adcbin/public/radar_index_large.asp?getArea=US_REG&nxtype=tp
3 hr
http://sirocco.accuweather.com/nx_mosaic_640x480c/tp/inmtpus_.gif
http://radar.accuweather.com/adcbin/public/radar_index_large.asp?getArea=US_REG&nxtype=24hr
http://sirocco.accuweather.com/nx_mosaic_640x480c/24hr/inm24hrus_.gif
http://radar.accuweather.com/adcbin/public/radar_index_large.asp?getArea=US_REG&nxtype=7d
http://sirocco.accuweather.com/nx_mosaic_640x480c/7d/inm7dus_.gif
http://radar.accuweather.com/adcbin/public/radar_index_large.asp?getArea=US_REG&nxtype=30d
http://sirocco.accuweather.com/nx_mosaic_640x480c/30d/inm30dus_.gif
http://radar.accuweather.com/adcbin/public/radar_index_large.asp?getArea=US_REG&nxtype=12m
http://sirocco.accuweather.com/nx_mosaic_640x480c/12m/inm12mus_.gif
http://image.weather.com/web/maps/radar/regions/us_rainfall_est_yesterday_720_en.jpg
http://image.weather.com/web/maps/radar/regions/us_rainfall_est_past_week_720_en.jpg
http://wxweb.meteostar.com/leads_images/radar/SYS_STORM_TOTAL_RAINFALL.gif
Satellite-Derived
Precipitation Estimates
_
http://www.ssd.noaa.gov/PS/PCPN/precip.html Satellite Precipitation Estimate (SPENES) messages and
Graphics
http://www.star.nesdis.noaa.gov/smcd/emb/ff/
http://www.star.nesdis.noaa.gov/smcd/emb/ff/auto.html Hydro-Estimator
http://www.star.nesdis.noaa.gov/smcd/emb/ff/gmsra.html Multispectral Precipitation Products
http://www.star.nesdis.noaa.gov/smcd/emb/ff/blended.html Blended IR/Microwave Precipitation Products
http://www.star.nesdis.noaa.gov/smcd/emb/ff/moist.html Moisture Products
http://www.star.nesdis.noaa.gov/smcd/emb/ff/hn.html Hydro-Nowcaster
http://www.nrlmry.navy.mil:80/sat-bin/rain.cgi? Experimental Geostationary Rain Estimation
http://wwwt.emc.ncep.noaa.gov/gmb/gdas/ SSM/I and TMI rain rates
http://manati.wwb.noaa.gov/doc/ssmiprecip.html Rate, Water Vapor and 85 GHz Tb -- SSM/I
http://trmm.gsfc.nasa.gov/publications_dir/precipitation_msg.html Near-recent Global
http://trmm.gsfc.nasa.gov/data/quicklook/quick_looks.html Near-recent Polar sat Global
http://trmm.gsfc.nasa.gov/trmmreal/ More-recent Polar sat Global
http://www.star.nesdis.noaa.gov/corp/scsb/mspps/ NOAA-15 16 17 Rain Monitoring
http://www.star.nesdis.noaa.gov/corp/scsb/wchen/AMSR-E/
http://www.osdpd.noaa.gov/PSB/SHARED_PROCESSING/SHARED_PROCESSING.html Rain, wind , etc. - recent polar sat
Precipitation
Type - Snow - Ice [also check Regional Models]
_
http://www.hpc.ncep.noaa.gov/basicwx/basicwx.shtml or http://www.hpc.ncep.noaa.gov/html/fcsttxt.html#shortrange
http://www.weather.gov/forecasts/graphical/sectors/conus.php?element=Wx
http://www.weather.gov/forecasts/graphical/sectors/conus.php?element=SnowAmt
http://coolwx.com/usstats/precstats.php
http://www.intellicast.com/IcastPage/LoadPage.aspx?loc=usa&seg=LocalWeather&prodgrp=RadarImagery&product=RadarLoop (cookie)
http://www.intellicast.com/IcastPage/LoadPage.aspx?loc=usa&seg=LocalWeather&prodgrp=RadarImagery&product=Radar (cookie)
http://www.accuweather.com/winter-center.asp
http://radar.accuweather.com/adcbin/public/radar_index_large.asp?getArea=US_REG&type=loop&nxtype=sir
http://www.accuweather.com/radar-large.asp?partner=accuweather&traveler=0&site=US_&type=SIR&anim=1&level=state&large=1
http://sirocco.accuweather.com/nx_mosaic_640x480c/sir/inmasirus_.gif
http://www.accuweather.com/maps-precipitation.asp?partner=accuweather&traveler=0&zipcode=&type=snow
http://www.weather.com/maps/maptype/dopplerradarusnational/uswinterradar_large_animated.html java loops
http://www.weather.com/maps/maptype/dopplerradarusnational/uswinterradar_large.html
http://image.weather.com/web/radar/us_winterradar_large_usen.jpg
http://www.wunderground.com/radar/mosaic.asp
_
Winter
Storm Warnings
http://www.weather.gov/ look for Winter Storm Warning and click in Graphical
Forecast down to the city
http://www.weather.gov/alerts/ (select state) text-only
http://www.weather.gov/view/national.php?prod=WSW
http://kamala.cod.edu/wsw/
http://www.spc.noaa.gov/products/wwa/ Watch, Warning
and Advisory Maps
http://www.spc.noaa.gov/products/md/ Mesoscale
Discussions
Major Winter Storm Summaries [issued as required]
http://www.hpc.ncep.noaa.gov/html/discuss.shtml scroll down to Storm Summaries NFDSCCNS# 1 to 5
or http://www.hpc.ncep.noaa.gov/html/fcsttxt.html#discussions go to NFDSCCNS# 1 to 5
_
http://www.hpc.ncep.noaa.gov/wwd/winter_wx.shtml Winter Weather Forecasts
http://www.hpc.ncep.noaa.gov/wwd/impactgraphics/ EXPERIMENTAL NCEP HPC and SPC, EMC SREF MODEL
http://www.hpc.ncep.noaa.gov/discussions/qpfhsd.html Heavy Snowfall Discussion Text
http://www.hpc.ncep.noaa.gov/qpf/qpf2.shtml Quantitative Precipitation Forecasts
or http://www.hpc.ncep.noaa.gov/qpf/qpftxt.html
http://ruc.fsl.noaa.gov/ select RUC
Precipitation type, 3-h snow accum/sfc temp, 12-h snow
accumulation, Snow water depth
http://w1.spc.woc.noaa.gov/exper/sref/frames.php?run=latest select Winter
Weather
http://w1.spc.woc.noaa.gov/exper/mesoanalysis/new/viewsector.php?sector=19 select Winter
Weather
http://wrf-model.org/plots/realtime_main.php select Snow Depth
http://www.nws.noaa.gov/mdl/synop/products.shtml Forecast Graphics
then Precipitation Type
http://www.nws.noaa.gov/mdl/forecast/graphics/MAV/ GFS (formerly AVN)
http://www.nws.noaa.gov/mdl/forecast/graphics/MAV/MAV.PTYPI_000.html PType Best Category
http://www.nws.noaa.gov/mdl/forecast/graphics/MAV/MAV.CFZI_000.html Cond Prob Freezing
http://www.nws.noaa.gov/mdl/forecast/graphics/MAV/MAV.CZNI_000.html Cond Prob Frozen
http://www.nws.noaa.gov/mdl/forecast/graphics/MAV/MAV.CLQI_000.html Cond Prob Rain
http://www.nws.noaa.gov/mdl/forecast/graphics/MAV/MAV.BSNA24_000.html 24H SNOW BEST CATEGORY
http://www.nws.noaa.gov/mdl/forecast/graphics/MEX/ MRF
http://www.nws.noaa.gov/mdl/forecast/graphics/MEX/MEX.BPCPT12_000.html PType Best Category
http://www.nws.noaa.gov/mdl/forecast/graphics/MEX/MEX.CPOZP12_000.html Cond Prob Frozen
http://www.nws.noaa.gov/mdl/forecast/graphics/MEX/MEX.CPOS12_000.html Cond Prob Snow
http://www.nws.noaa.gov/mdl/forecast/graphics/MEX/MEX.CPORS12_000.html Cond Prob Rain/Snow
http://www.nws.noaa.gov/mdl/forecast/graphics/MEX/MEX.CPORA12_000.html Cond Prob Rain
http://www.nws.noaa.gov/mdl/forecast/graphics/MET/ NAM (formerly ETA)
http://www.nws.noaa.gov/mdl/forecast/graphics/MET/MET.BSNA24_000.htm 24H SNOW BEST CATEGORY
http://www.emc.ncep.noaa.gov/mmb/namsvrfcst/check Precipitation Type NAM (formerly
ETA) Forecast
http://www.emc.ncep.noaa.gov/mmb/mmbpll/etapll/ check
Precipitation Type NAM (formerly ETA) Forecast
http://www.emc.ncep.noaa.gov/mmb/mmbpll/etapllsup12/ check
Precipitation Type NAM (formerly ETA) Forecast
http://wwwt.emc.ncep.noaa.gov/mmb/precip_type/ check
Precipitation Type NAM (formerly ETA) Forecast
http://sanders.math.uwm.edu/cgi-bin-snowratio/sr_intro.pl realtime snow-ratio forecast
http://strc.comet.ucar.edu/realtime/ptype/ NAM (formerly ETA)
http://www.coolwx.com/ptype/ NAM (formerly ETA)
http://weather.unisys.com/eta/winter.html NAM (formerly ETA)
Winter Forecasts
http://aviationweather.gov/products/swl/ has Freezing Line
http://aviationweather.gov/adds/icing/
http://weatheroffice.ec.gc.ca//model_forecast/aviation_products_e.html has Freezing Line
http://weatheroffice.ec.gc.ca//model_forecast/index_e.html select
Precipitation
http://image.weather.com/images/maps/forecast/precfcst_720x486.jpg
http://image.weather.com/images/maps/travel/trvlsnow_720x486.jpg
http://image.weather.com/images/maps/travel/trvlsno2_720x486.jpg
http://image.weather.com/images/maps/forecast/snowfcst_720x486.jpg
http://image.weather.com/images/maps/winter/sno_qual_720x486.jpg
http://image.weather.com/images/maps/winter/sno_qual_east_720x486.jpg
http://image.weather.com/images/maps/winter/sno_qual_west_720x486.jpg
http://image.weather.com/images/maps/winter/skieastq_720x486.jpg
http://image.weather.com/images/maps/winter/skiwestq_720x486.jpg
http://image.weather.com/images/maps/winter/us_snowcover_large_usen.jpg
http://image.weather.com/images/maps/winter/frost_720x486.jpg
http://image.weather.com/images/maps/special/record_snow_1_720x486.jpg
http://image.weather.com/images/maps/special/record_snow_2_720x486.jpg
http://image.weather.com/images/maps/special/snohist1_720x486.jpg
http://image.weather.com/images/maps/special/snohist2_720x486.jpg
http://image.weather.com/images/maps/winter/normal_first_freeze_720x486.jpg
http://image.weather.com/images/maps/winter/normal_last_freeze_720x486.jpg
http://twister.sbs.ohio-state.edu/imageg.php?dispimg=surface/current_analy&imgname=Current+Analysis
Snow Cover
http://www.nohrsc.noaa.gov/
http://www.nohrsc.noaa.gov/nsa/
http://www.star.nesdis.noaa.gov/smcd/emb/snow/HTML/snow.htm
http://www.natice.noaa.gov/ims/ Snow Cover
http://www.rap.ucar.edu/weather/surface/
http://www.rap.ucar.edu/weather/surface/us_AFsnow.gif
http://www.rap.ucar.edu/weather/surface/us_NESDISsnow.gif
http://www.ncdc.noaa.gov/oa/climate/research/snow/snow.html Recent Snowfall
& Snowdepth Maps
http://weatheroffice.ec.gc.ca/analysis/index_e.html go to Surface Analysis : Snow, Ice, SST
http://www.cpc.ncep.noaa.gov/products/monitoring_and_data/us_snow.shtml
http://www.cpc.ncep.noaa.gov/products/season_update/ Experimental
Daily NWS/Coop Snow Depth and Snowfall Graphics & Data
http://www.wunderground.com/US/Region/US/SnowDepth.html
http://icons.wunderground.com/data/640x480/us_snow_anim.gif
http://icons.wunderground.com/data/640x480/2xus_snow.gif
http://icons.wunderground.com/data/images/us_snow.gif
http://www.snow-forecast.com/
http://www.snow-forecast.com/index2.php
http://www.cpc.ncep.noaa.gov/products/predictions/threats/
http://www.cpc.ncep.noaa.gov/products/predictions/threats/p_threats.gif Precipitation
Threat Week Forecast
http://www.cpc.ncep.noaa.gov/products/winter_outlook/ Winter Season
Outlook issued in October
http://www.cpc.ncep.noaa.gov/products/expert_assessment/
http://www.cpc.ncep.noaa.gov/products/expert_assessment/threats.shtml
http://www.cpc.ncep.noaa.gov/products/monitoring_and_data/us_prec.shtml
? http://satpc.ou.edu/~ldm/difax/snowcover.jpg
? http://cirrus.smsu.edu/home/mcidas/data/mc/Snow_cover.gif
http://weather.unisys.com/surface/snow_cover.html
http://vortex.plymouth.edu/
http://vortex.plymouth.edu/obsnow.gif
? http://www.ametsoc.org/dstreme/images/snow.gif
http://www.ssd.noaa.gov/PS/PCPN/DATA/RT/na-gssk-loop.html
http://www.ssd.noaa.gov/PS/PCPN/DATA/RT/NA/GSSK/20.jpg GOES Sounder Skin
Temp
http://www.star.nesdis.noaa.gov/smcd/opdb/goes/dpi/html23L/sdpiimg023l.html check TSKN and FRZL
http://www.ghcc.msfc.nasa.gov/goesprod/ select Sounder then Surface Skin Temperature
http://www.nws.noaa.gov/om/winter/index.shtml Winter Weather Safety and Awareness
http://www.nws.noaa.gov/om/brochures/wntrstm.htm
http://www.crh.noaa.gov/bis/winter.htm Winter Weather Safety
http://www.redcross.org/services/disaster/0,1082,0_595_,00.html
http://www.cimms.ou.edu/~cortinas/preprints/waf15/climo.html CLIMATOLOGY OF FREEZING RAIN: PRELIMINARY RESULTS
Polar Ice
http://www.natice.noaa.gov/home/home1.htm
http://science.natice.noaa.gov/scienceDisplay.htm
http://science.natice.noaa.gov/ice_edge/ice_edge.htm
http://science.natice.noaa.gov/wisif/imgmap_new.htm
http://science.natice.noaa.gov/icImages/
http://www.natice.noaa.gov/products/gl-ches/
http://www.natice.noaa.gov/products/alaska/
http://www.natice.noaa.gov/products/iceberg/
http://www.star.nesdis.noaa.gov/sod/mecb/sar/ Synthectic Aperture Radar - Alaska
http://www7320.nrlssc.navy.mil/pips2/
http://nsidc.org/
http://icesat.gsfc.nasa.gov/
http://www.csr.utexas.edu/grace/
http://web.pdx.edu/~chulbe/glaciolinks.html
http://ice-glaces.ec.gc.ca/App/WsvPageDsp.cfm?ID=1&Lang=eng
http://www.dmi.dk/eng/index/forecasts.html
Temperature
- Dew Point - Humidity
_
http://www.weather.gov/forecasts/graphical/sectors/conus.php?element=T Temperature
http://www.weather.gov/forecasts/graphical/sectors/conus.php?element=Td Dewpoint
http://www.weather.gov/forecasts/graphical/sectors/conus.php?element=MaxMinT
http://www.weather.gov/forecasts/graphical/sectors/conus.php?element=MaxT
http://www.weather.gov/forecasts/graphical/sectors/conus.php?element=MinT
http://coolwx.com/usstats/tempstats.php
http://coolwx.com/usstats/tempchstats.php
http://coolwx.com/usstats/tempadvstats.php
http://coolwx.com/usstats/dewpstats.php
http://ruc.fsl.noaa.gov/ select RUC
http://www.rap.ucar.edu/weather/surface/
http://www.rap.ucar.edu/weather/surface/us_temp.gif
http://www.rap.ucar.edu/weather/surface/us_dewp.gif
http://www.caps.ou.edu/wx/p/r/conus/adas/ Temperature - Dew
Point
http://www.hpc.ncep.noaa.gov/html/sfctxt.html#sfcobs
http://www.hpc.ncep.noaa.gov/medr/medr.shtml or http://www.hpc.ncep.noaa.gov/html/fcsttxt.html#mediumrange
http://mapmaker.meteor.wisc.edu/~wxp/sfc/
http://www.nws.noaa.gov/mdl/forecast/graphics/MAV/ GFS (formerly AVN)
http://www.nws.noaa.gov/mdl/forecast/graphics/MAV/MAV.TMPF_000.html Temperature
http://www.nws.noaa.gov/mdl/forecast/graphics/MAV/MAV.DWPF_000.html Dewpoint
http://www.nws.noaa.gov/mdl/forecast/graphics/MAV/MAV.MINF_000.html Nighttime Minimum
http://www.nws.noaa.gov/mdl/forecast/graphics/MAV/MAV.MAXF_000.html Daytime Maximum
http://www.nws.noaa.gov/mdl/forecast/graphics/MET/ NAM (formerly ETA)
http://www.nws.noaa.gov/mdl/forecast/graphics/MET/MET.TMPF_000.html Temperature
http://www.nws.noaa.gov/mdl/forecast/graphics/MET/MET.DWPF_000.html Dewpoint
http://www.nws.noaa.gov/mdl/forecast/graphics/MET/MET.MINF_000.html Nighttime Minimum
http://www.nws.noaa.gov/mdl/forecast/graphics/MET/MET.MAXF_000.html Daytime Maximum
http://www.nws.noaa.gov/mdl/forecast/graphics/MEX/ MRF
http://www.nws.noaa.gov/mdl/forecast/graphics/MEX/MEX.TMPF_000.html Temperature
http://www.nws.noaa.gov/mdl/forecast/graphics/MEX/MEX.DWPF_000.html Dewpoint
http://www.nws.noaa.gov/mdl/forecast/graphics/MEX/MEX.MINF_000.html Nighttime Minimum
http://www.nws.noaa.gov/mdl/forecast/graphics/MEX/MEX.MAXF_000.html Daytime Maximum
http://weather.unisys.com/surface/sfc_con_temp.html
http://weather.unisys.com/surface/sfc_con_24temp.html
http://weather.unisys.com/surface/sfc_con_dewp.html
http://weather.unisys.com/surface/sfc_con_temp_na.html
http://twister.sbs.ohio-state.edu/main.php?pageloc=surface
http://ww2010.atmos.uiuc.edu/(Gh)/wx/surface.rxml
http://ww2010.atmos.uiuc.edu/wx/cwp/prods/current/sfctmp/sfctmp_N.gif Temperature
http://ww2010.atmos.uiuc.edu/wx/cwp/prods/current/sfctdp/sfctdp_N.gif Dew Point
http://www.accuweather.com/maps-temperature.asp?partner=accuweather&traveler=0&zipcode=&type=fhgh
http://www.accuweather.com/maps-temperature.asp?partner=accuweather&traveler=0&zipcode=&type=flow
http://www.wunderground.com/US/Region/US/Temperature.html
http://icons.wunderground.com/data/640x480/us_st_anim.gif Temperature
http://icons.wunderground.com/data/640x480/2xus_st.gif
http://icons.wunderground.com/data/images/us_st.gif
http://www.wunderground.com/US/Region/US/Dewpoint.html
http://icons.wunderground.com/data/640x480/us_dp_anim.gif Dew Point
http://icons.wunderground.com/data/640x480/2xus_dp.gif
http://icons.wunderground.com/data/images/us_dp.gif
http://www.wunderground.com/US/Region/US/Humidity.html
http://icons.wunderground.com/data/640x480/us_rh_anim.gif Relative Humidity
http://icons.wunderground.com/data/640x480/2xus_rh.gif
http://icons.wunderground.com/data/images/us_rh.gif
http://weather.noaa.gov/pub/fax/QTTA00.TIF Max Temperatures
http://weather.noaa.gov/pub/fax/QTTA01.TIF Min Temperatures
http://weather.noaa.gov/pub/fax/QTTE00.TIF Max, Min
Temperature Forecast - NGM
http://weather.noaa.gov/pub/fax/QRUA00.TIF Average SFC-500MB
Relative Humidity
http://weather.colorado.edu/pages/mainnat.html
http://vortex.plymouth.edu/
http://vortex.plymouth.edu/psc_ustemp.gif
http://wwwagwx.ca.uky.edu/ldm-images/latestdewp.gif
http://wwwagwx.ca.uky.edu/dewp_cond_eta_fcst.htm
http://www.ametsoc.org/dstreme/images/sfc_adv.gif
http://www.ametsoc.org/dstreme/images/mint.gif 24 hr. Minimum
temp.
http://www.ametsoc.org/dstreme/images/maxt.gif 24 hr. Maximum
temp.
http://www.emc.ncep.noaa.gov/mmb/mmbpll/etapll/ Check 2-M
Temperature (deg C) Forecast
http://www.emc.ncep.noaa.gov/mmb/mmbpll/etapllsup12/ Check 2-M
Temperature (deg C) Forecast
http://wxmaps.org/pix/ez.namer.html Forecasts of
precipitation, high, and low temperatures
http://wxmaps.org/pix/temp1.html 10-day temperature outlook
http://wwwghcc.msfc.nasa.gov/Model/model_mm5conustable0.html
http://www.cpc.ncep.noaa.gov/pacdir/NFORdir/jo1.html Probability of
Temperature Exceedance
http://www.cpc.ncep.noaa.gov/pacdir/NFORdir/citydir/explanation_ctydf.html Temperature
Outlook for Major U.S. Cities
_
http://image.weather.com/images/maps/special/24h_temp_chg_720x486.jpg
http://image.weather.com/images/maps/special/norm_dep_hi_720x486.jpg
http://image.weather.com/images/maps/special/norm_dep_low_720x486.jpg
http://image.weather.com/images/maps/current/curtemps_720x486.jpg Actual Highs
http://image.weather.com/images/maps/current/actual_los_720x486.jpg Actual Lows
http://image.weather.com/images/maps/current/acttemp_720x486.jpg Current Temperatures
http://image.weather.com/images/maps/current/actdew_720x486.jpg Current Dew Points
http://image.weather.com/images/maps/forecast/tompmfcst_720x486.jpg Tomorrow Forecast
http://image.weather.com/web/forecast/us_wxhi1_large_usen.jpg Today's Forecast
http://image.weather.com/web/forecast/us_wxlo1_large_usen.jpg Tonight's Forecast
http://image.weather.com/web/forecast/us_wxhi2_large_usen.jpg
http://image.weather.com/web/forecast/us_wxlo2_large_usen.jpg
http://image.weather.com/web/forecast/us_wxhi3_large_usen.jpg
http://image.weather.com/web/forecast/us_wxlo3_large_usen.jpg
http://image.weather.com/web/forecast/us_wxhi4_large_usen.jpg
http://image.weather.com/web/forecast/us_wxlo4_large_usen.jpg
http://image.weather.com/web/forecast/us_wxhi5_large_usen.jpg
http://image.weather.com/web/forecast/us_wxlo5_large_usen.jpg
http://image.weather.com/web/forecast/us_wxhi6_large_usen.jpg
http://image.weather.com/web/forecast/us_wxlo6_large_usen.jpg
http://image.weather.com/web/forecast/us_wxhi7_large_usen.jpg
http://image.weather.com/web/forecast/us_wxlo7_large_usen.jpg
http://image.weather.com/web/forecast/us_wxhi8_large_usen.jpg
http://image.weather.com/web/forecast/us_wxlo8_large_usen.jpg
http://image.weather.com/web/forecast/us_wxhi9_large_usen.jpg
http://image.weather.com/web/forecast/us_wxlo9_large_usen.jpg
http://image.weather.com/web/forecast/us_wxhi10_large_usen.jpg
http://image.weather.com/web/forecast/us_wxlo10_large_usen.jpg
http://image.weather.com/images/maps/special/30Day_Temp_720x486.jpg
http://image.weather.com/images/maps/special/90Day_Temp_720x486.jpg
http://www.intellicast.com/IcastPage/LoadPage.aspx?loc=usa&seg=LocalWeather&prodgrp=SurfaceMaps&product=HighToday (cookie)
http://www.intellicast.com/IcastPage/LoadPage.aspx?loc=usa&seg=LocalWeather&prodgrp=SurfaceMaps&product=LowTomorrow (cookie)
http://www.intellicast.com/IcastPage/LoadPage.aspx?loc=usa&seg=LocalWeather&prodgrp=SurfaceMaps&product=HighTomorrow (cookie)
http://www.cpc.ncep.noaa.gov/products/monitoring_and_data/us_prec.shtml
http://www.ssd.noaa.gov/PS/PCPN/DATA/RT/na-gssk-loop.html
http://www.ssd.noaa.gov/PS/PCPN/DATA/RT/NA/GSSK/20.jpg GOES Sounder Skin
Temp
http://www.star.nesdis.noaa.gov/smcd/opdb/goes/dpi/html23L/sdpiimg023l.html check TSKN and FRZL
http://www.ghcc.msfc.nasa.gov/goesprod/ select Sounder then Surface Skin Temperature
Heat
Index
_
http://www.weather.gov/ look for Heat Advisory or Excessive Heat Warning and
click in Graphical Forecast down to the city
http://www.weather.gov/alerts/ (select state) text-only
http://www.weather.gov/view/national.php?prod=NPW
Excessive Heat Warning: Heat Index of 115 or greater and night
time low heat index at or above 80 degrees for 24 hours or more
Heat Advisory: Heat Index of 105 or greater and night time low
heat index at or above 80 degrees for 24 hours or more
Excessive Heat Watches: Generally for 12-36 hr period
Excessive Heat Outlooks: Issued for 2nd or 3rd day of forecast
NOAA's National Weather Service is developing a plan to expand
new Heat/Health Watch Warning Systems from the current 16 cities
to each municipality with a population exceeding 500,000.
Excessive heat on average has been the number one weather-related
killer, causing more fatalities per year than floods, lightning,
tornadoes, hurricanes, winter storms and extreme cold.
http://www.weather.gov/forecasts/graphical/sectors/conus.php?element=ApparentT Apparent Temperature and local Heat Index Maps
http://coolwx.com/usstats/heatstats.php
http://www.hpc.ncep.noaa.gov/sfc/sfcobs/sfcobs.shtml
http://www.hpc.ncep.noaa.gov/sfc/sfcobs/small_latestsfchi.gif current heat index small map
http://www.hpc.ncep.noaa.gov/sfc/sfcobs/large_latestsfchi.gif current heat index large map
http://www.hpc.ncep.noaa.gov/heat_index.shtml
http://www.cpc.ncep.noaa.gov/products/predictions/short_range/heat/hi_610.php
http://twister.sbs.ohio-state.edu/main.php?pageloc=surface
http://vortex.plymouth.edu/
http://vortex.plymouth.edu/usheat.gif
http://weather3.ca.uky.edu/at.htm
http://weather.unisys.com/surface/sfc_con_heat.html
http://www.accuweather.com/maps-galileo.asp?partner=accuweather&traveler=0&zipcode=&type=heatindex
http://www.wunderground.com/US/Region/US/HeatIndex.html
http://icons.wunderground.com/data/640x480/us_hi_anim.gif
http://icons.wunderground.com/data/640x480/2xus_hi.gif
http://icons.wunderground.com/data/images/us_hi.gif
http://image.weather.com/images/maps/current/actheat_720x486.jpg
http://image.weather.com/images/maps/forecast/forheat_ind_720x486.jpg
http://www.nws.noaa.gov/om/heat/index.shtml Heat Index Chart
Wind
Chill
_
http://www.weather.gov/ look for Wind Chill Warning, Watch, or Advisory and
click in Graphical Forecast down to the city for Wind Chill
Graphics
http://www.weather.gov/alerts/ (select state) includes Wind Chill Warning, Watch, or
Wind Chill Advisory text-only
http://www.weather.gov/view/national.php?prod=WSW
http://www.weather.gov/forecasts/graphical/sectors/conus.php?element=ApparentT Apparent Temperature and local Wind Chill Maps
http://coolwx.com/usstats/chillstats.php
http://www.hpc.ncep.noaa.gov/sfc/sfcobs/sfcobs.shtml
http://www.hpc.ncep.noaa.gov/sfc/sfcobs/small_latestsfcwc.gif ? current wind chill small map
http://www.hpc.ncep.noaa.gov/sfc/sfcobs/large_latestsfcwc.gif ? current wind chill large map
http://www.cpc.ncep.noaa.gov/products/predictions/short_range/cold/wc_610.php Experimental 6-10 Days
http://www.cpc.ncep.noaa.gov/products/predictions/short_range/cold/wc_814.php Experimental 8-14 Days
http://weather.unisys.com/surface/sfc_con_wchill.html
http://www.accuweather.com/maps-galileo.asp?partner=accuweather&traveler=0&type=wchill
http://image.weather.com/images/maps/current/actchill_720x486.jpg
http://image.weather.com/images/maps/forecast/forchill_720x486.jpg
http://vortex.plymouth.edu/
http://vortex.plymouth.edu/uschill.gif
http://www.wunderground.com/US/Region/US/Windchill.html
http://icons.wunderground.com/data/640x480/us_wc_anim.gif
http://icons.wunderground.com/data/640x480/2xus_wc.gif
http://icons.wunderground.com/data/images/us_wc.gif
http://weather3.ca.uky.edu/wci.htm
http://www.nws.noaa.gov/om/windchill/ Wind Chill Chart
Winds
at Surface [not useful for details of Tropical Cyclone
winds]
_
http://www.weather.gov/forecasts/graphical/sectors/conus.php?element=WindSpd
http://coolwx.com/usstats/windstats.php
http://ruc.fsl.noaa.gov/ select RUC
http://www.nws.noaa.gov/mdl/forecast/graphics/MAV/ GFS (formerly AVN)
http://www.nws.noaa.gov/mdl/forecast/graphics/MAV/MAV.SKNT_000.html Inflated Wind Speed
http://www.nws.noaa.gov/mdl/forecast/graphics/MAV/MAV.STREAM_000.html Streamlines
http://www.nws.noaa.gov/mdl/forecast/graphics/MAV/MAV.BRBK_000.html Wind Barbs
http://www.nws.noaa.gov/mdl/forecast/graphics/MET/ NAM (formerly ETA)
http://www.nws.noaa.gov/mdl/forecast/graphics/MET/MET.SKNT_000.html Inflated Wind Speed
http://www.nws.noaa.gov/mdl/forecast/graphics/MET/MET.STREAM_000.html Streamlines
http://www.nws.noaa.gov/mdl/forecast/graphics/MET/MET.BRBK_000.html Wind Barbs
http://www.nws.noaa.gov/mdl/forecast/graphics/MEX/ MRF
http://www.nws.noaa.gov/mdl/forecast/graphics/MEX/MEX.MWSPK12_000.html 12H Max Wind Speed
http://www.nws.noaa.gov/mdl/forecast/graphics/MEX/MEX.PWSP112_000.html Prob. of Max Wind 0-12 Kts
http://www.nws.noaa.gov/mdl/forecast/graphics/MEX/MEX.PWSP212_000.html Prob. of Max Wind 13-21Kts
http://www.nws.noaa.gov/mdl/forecast/graphics/MEX/MEX.PWSP312_000.html Prob. of Max Wind 22-31Kts
http://www.nws.noaa.gov/mdl/forecast/graphics/MEX/MEX.PWSP412_000.html Prob. of Max Wind 32+Kts
http://www.caps.ou.edu/wx/p/r/conus/fcst/ select Wind Speed
http://weather.unisys.com/surface/sfc_con_wspd.html
http://weather.unisys.com/surface/sfc_con_stream.html
http://www.rap.ucar.edu/weather/surface/
http://www.rap.ucar.edu/weather/surface/us_wind.gif
http://www.emc.ncep.noaa.gov/mmb/mmbpll/etapll10.East10/ Check 10-M Wind
Forecast
http://www.emc.ncep.noaa.gov/mmb/mmbpll/etapllsup12/ Check 10-M Wind
Forecast
http://wwwghcc.msfc.nasa.gov/Model/model_mm5conustable0.html
http://twister.sbs.ohio-state.edu/main.php?pageloc=surface
http://twister.sbs.ohio-state.edu/main.php?pageloc=model
http://www.wunderground.com/US/Region/US/WindSpeed.html
http://icons.wunderground.com/data/640x480/us_ws_anim.gif
http://icons.wunderground.com/data/640x480/2xus_ws.gif
http://icons.wunderground.com/data/images/us_ws.gif
http://www.accuweather.com/maps-winds.asp?partner=accuweather&traveler=0&zipcode=&type=wsp&fday=1
http://weather.colorado.edu/pages/mainnat.html
http://image.weather.com/images/maps/boat-n-beach/us_wind_cur_720x486.jpg
http://image.weather.com/images/maps/boat-n-beach/us_wind_fcst_720x486.jpg
http://image.weather.com/images/maps/travel/trvlwind_720x486.jpg
Visibilty - Fog - Obstructions to Visibilty
_
also check
Satellite page at Fog/Fire
http://www.weather.gov/forecasts/graphical/sectors/conus.php?element=Wx Fog Forecast
http://polar.ncep.noaa.gov/marine.meteorology/coastal.visibility/ Fog Forecast
http://ruc.noaa.gov/pig.cgi?13km_oper Forecast select Fog and Visibility [more models to
choose from on their page]
http://wwwt.emc.ncep.noaa.gov/mmb/wd20bz/SREF_aviation/web_site/html_212/visib.html Fog Forecast
http://www.nws.noaa.gov/mdl/lamp/ Fog Forecast
http://www.nws.noaa.gov/mdl/forecast/graphics/MAV/ GFS (formerly AVN)
http://www.nws.noaa.gov/mdl/forecast/graphics/MAV/MAV.VISC_000.html Visibility
http://www.nws.noaa.gov/mdl/forecast/graphics/MAV/MAV.PVIS1_000.html Prob. Vis <= 1/4 mi
http://www.nws.noaa.gov/mdl/forecast/graphics/MAV/MAV.PVIS2_000.html Prob. Vis >1/4 - <= 1/2 mi
http://www.nws.noaa.gov/mdl/forecast/graphics/MAV/MAV.PVIS3_000.html Prob. Vis >1/2 - < 1 mi
http://www.nws.noaa.gov/mdl/forecast/graphics/MAV/MAV.PVIS4_000.html Prob. Vis 1 - <3 mi
http://www.nws.noaa.gov/mdl/forecast/graphics/MAV/MAV.PVIS5_000.html Prob. Vis 3 - 5 mi
http://www.nws.noaa.gov/mdl/forecast/graphics/MAV/MAV.PVIS6_000.html Prob. Vis 6 miles
http://www.nws.noaa.gov/mdl/forecast/graphics/MAV/MAV.OBVC_000.html Obstructions to Vision
http://www.nws.noaa.gov/mdl/forecast/graphics/MAV/MAV.POBVH_000.html Prob. of Haze
http://www.nws.noaa.gov/mdl/forecast/graphics/MAV/MAV.POBVM_000.html Prob. of Mist
http://www.nws.noaa.gov/mdl/forecast/graphics/MAV/MAV.POBVF_000.html Prob. of Fog
http://twister.sbs.ohio-state.edu/main.php?pageloc=surface
http://www.wunderground.com/US/Region/US/Visibility.html
http://icons.wunderground.com/data/640x480/us_vs_anim.gif Visibilty
http://icons.wunderground.com/data/640x480/2xus_vs.gif
http://icons.wunderground.com/data/images/us_vs.gif
http://aviationweather.gov/data/obs/sat/goes/vis_goesE.jpg Visible/Fog East
U.S.
http://aviationweather.gov/data/obs/sat/goes/vis_goesW.jpg Visible/Fog West
U.S
http://aviationweather.gov/adds/metars/
http://www.star.nesdis.noaa.gov/smcd/opdb/aviation/fog.html GOES Nighttime
Fog and Low Clouds
http://image.weather.com/images/maps/travel/trvlfog_720x486.jpg
Sky
Cover - Ceiling Height
_
http://www.weather.gov/forecasts/graphical/sectors/conus.php?element=Sky
http://coolwx.com/usstats/cloudstats.php
http://ruc.fsl.noaa.gov/ select RUC Cloud
top height Cloud base height (ceiling)
http://www.nws.noaa.gov/mdl/forecast/graphics/MAV// GFS (formerly AVN)
http://www.nws.noaa.gov/mdl/forecast/graphics/MAV/MAV.BCIG_000.html Ceiling Height (Cat)
http://www.nws.noaa.gov/mdl/forecast/graphics/MAV/MAV.PCIG1_000.html Prob. of Ceiling < 200 ft
http://www.nws.noaa.gov/mdl/forecast/graphics/MAV/MAV.PCIG2_000.html Prob. of Ceiling 200-400 ft
http://www.nws.noaa.gov/mdl/forecast/graphics/MAV/MAV.PCIG3_000.html Prob. of Ceiling 500-900 ft
http://www.nws.noaa.gov/mdl/forecast/graphics/MAV/MAV.PCIG4_000.html Prob. of Ceiling 1000-3000 ft
http://www.nws.noaa.gov/mdl/forecast/graphics/MAV/MAV.PCIG5_000.html Prob. of Ceiling 3100-6500 ft
http://www.nws.noaa.gov/mdl/forecast/graphics/MAV/MAV.PCIG6_000.html Prob. of Ceiling 6600-12000ft
http://www.nws.noaa.gov/mdl/forecast/graphics/MAV/MAV.PCIG7_000.html Prob. of Ceiling > 12000 ft
http://www.nws.noaa.gov/mdl/forecast/graphics/MAV/MAV.SKYC_000.html Total Sky Cover (Cat)
http://www.nws.noaa.gov/mdl/forecast/graphics/MAV/MAV.PSKCL_000.html Prob. of Clear Total Sky
http://www.nws.noaa.gov/mdl/forecast/graphics/MAV/MAV.PSKSC_000.html Prob. of Scattered Total Sky
http://www.nws.noaa.gov/mdl/forecast/graphics/MAV/MAV.PSKBK_000.html Prob. of Broken Total Sky
http://www.nws.noaa.gov/mdl/forecast/graphics/MAV/MAV.PSKOV_000.html Prob. of Overcast Total Sky
http://www.nws.noaa.gov/mdl/forecast/graphics/MET/ NAM (formerly ETA)
http://www.nws.noaa.gov/mdl/forecast/graphics/MET/MET.SKYC_000.html Total Sky - Best Cat.
http://www.nws.noaa.gov/mdl/forecast/graphics/MET/MET.PSKCL_000.html Prob. of Clear Total Sky
http://www.nws.noaa.gov/mdl/forecast/graphics/MET/MET.PSKSC_000.html Prob. of Scattered Total Sky
http://www.nws.noaa.gov/mdl/forecast/graphics/MET/MET.PSKBK_000.html Prob. of Broken Total Sky
http://www.nws.noaa.gov/mdl/forecast/graphics/MET/MET.PSKOV_000.html Prob. of Overcast Total Sky
http://www.nws.noaa.gov/mdl/forecast/graphics/MEX/ MRF
http://www.nws.noaa.gov/mdl/forecast/graphics/MEX/MEX.MSKYC12_000.html Cat. Mean Total Sky Cover
http://www.nws.noaa.gov/mdl/forecast/graphics/MEX/MEX.MSKMC12_000.html Prob. of Mostly Clear
http://www.nws.noaa.gov/mdl/forecast/graphics/MEX/MEX.MSKPC12_000.html Prob. of Partly Cloudy
http://www.nws.noaa.gov/mdl/forecast/graphics/MEX/MEX.MSKMO12_000.html Prob. of Mostly Cloudy
http://www.hpc.ncep.noaa.gov/newrpp/rpp_cc.shtml Day 3-7 Cloud
Cover Products
Pressure - Surface Fronts
_
http://coolwx.com/usstats/presstats.php
http://coolwx.com/usstats/pchstats.php
http://www.rap.ucar.edu/weather/surface/
http://www.rap.ucar.edu/weather/surface/us_mslp.gif
http://www.rap.ucar.edu/weather/surface/us_ptnd.gif
http://www.hpc.ncep.noaa.gov/html/sfc2.shtml
or http://www.hpc.ncep.noaa.gov/html/sfctxt.html
http://weather.noaa.gov/fax/surface.shtml
http://weather.unisys.com/surface/sfc_con_pres.html
http://weather.unisys.com/surface/sfc_con_3pres.html
http://weather.unisys.com/surface/sfc_front.html
http://www.accuweather.com/maps-surface.asp?partner=accuweather&traveler=0&zipcode=&type=sfc
http://cirrus.smsu.edu/home/mcidas/data/mc/PRE.gif
http://cirrus.smsu.edu/home/mcidas/data/mc/STR.gif
http://www.wunderground.com/US/Region/US/Fronts.html
http://icons.wunderground.com/data/640x480/us_sf_anim.gif
http://icons.wunderground.com/data/640x480/2xus_sf.gif
http://icons.wunderground.com/data/images/us_sf.gif
http://www.ametsoc.org/dstreme/images/sfcppres.gif
http://ww2010.atmos.uiuc.edu/(Gh)/wx/surface.rxml
http://ww2010.atmos.uiuc.edu/wx/cwp/prods/current/irslpvec/irslpvec_N.gif Sea Level
Pressure with IR Satellite & Wind Vectors
http://weather.uwyo.edu/surface/front.html javascript
http://aviationweather.gov/products/swl/
http://weather.colorado.edu/pages/mainnat.html
http://squall.sfsu.edu/gif/sathts_snd_00.gif
http://www.ametsoc.org/dstreme/images/sfc_map.gif
http://www.ametsoc.org/dstreme/images/sfc_pres.gif
http://mcdemo.unidata.ucar.edu/images/NASFC.GIF
http://mcdemo.unidata.ucar.edu/images/GEFRONT.GIF
Degree
Days
_
http://www.cpc.ncep.noaa.gov/products/predictions/experimental/ddtest/weekass.shtml Degree Day
Assessments
http://www.cpc.ncep.noaa.gov/products/analysis_monitoring/cdus/degree_days/DDF_index.shtml Degree Days
Weekly Forecasts
http://www.cpc.ncep.noaa.gov/pacdir/NFORdir/citydir/explanation_ctydf.html Heating and
Cooling Degree Days for Major U.S. Cities
http://image.weather.com/images/maps/temperature/forecast/energy_day1_fcst_720_usen.jpg
http://image.weather.com/images/maps/temperature/forecast/energy_day2_fcst_720_usen.jpg
http://image.weather.com/images/maps/temperature/forecast/energy_day3_fcst_720_usen.jpg
http://image.weather.com/images/maps/temperature/forecast/energy_day4_fcst_720_usen.jpg
http://image.weather.com/images/maps/temperature/forecast/energy_day5_fcst_720_usen.jpg
http://image.weather.com/images/maps/temperature/forecast/energy_day6_fcst_720_usen.jpg
http://image.weather.com/images/maps/temperature/forecast/energy_day7_fcst_720_usen.jpg
http://image.weather.com/images/maps/temperature/forecast/energy_day8_fcst_720_usen.jpg
http://image.weather.com/images/maps/temperature/forecast/energy_day9_fcst_720_usen.jpg
http://image.weather.com/images/maps/temperature/forecast/energy_day10_fcst_720_usen.jpg
Rivers - Lakes
_
http://www.weather.gov/ahps/ Advanced Hydrologic Prediction Service
http://ahps.srh.noaa.gov/index.php?wfo=jax Advanced Hydrologic Prediction Service - Jacksonville
http://www.weather.gov/ahps/rfc/rfc.php River Forecast Centers (RFC) click-on Map
http://www.srh.noaa.gov/default1.html River Forecast Centers (RFC) click-on Map
http://www.hpc.ncep.noaa.gov/nationalfloodoutlook/index.html Significant River
Flood Outlook
http://water.usgs.gov/ Daily Streamflow
Conditions
http://waterdata.usgs.gov/ River Streamflow
Data
http://www.srh.noaa.gov/jax/text.php?sid=JAX&pil=RR3 SRUS52 KJAX - RR3JAX OCAF1 Ocala
http://www.srh.noaa.gov/port/pil.php?pil=JAXRR3JAX
http://iwin.nws.noaa.gov/view/validProds.php?prod=RR3&node=KJAX
http://www.weather.gov/view/validProds.php?prod=RR3&node=KJAX
http://www.usace.army.mil/divdistmap.html US Army Corps of
Engineers map of Engineer Divisions and Districts
http://www.saj.usace.army.mil/h2o/ Florida river and
lake plots and graphs
http://www.dep.state.fl.us/secretary/watman/ Florida Water
Management Districts
http://sjr.state.fl.us/ St. Johns River
Water Management District
http://www.glerl.noaa.gov/data/ Great Lakes
Environmental Research Laboratory
http://www.glerl.noaa.gov/res/glcfs/ The Great Lakes
Forecasting System (GLFS)
http://glakesonline.nos.noaa.gov/ Great Lakes Water
Level platforms
Lightning
_
http://www.nws.noaa.gov/mdl/gfslamp/cnvltg.php 0-3 Hour Lightning and Convection Forecasts
http://www.nws.noaa.gov/mdl/scan/scan_svr_03h.php 0-3 Hour Rainfall, Lightning and Severe Weather
Forecasts
http://www.nws.noaa.gov/mdl/radar/smv_03h_probltg.gif * Conus Forecast for 3 hours updated every 30 minutes
http://www.nws.noaa.gov/mdl/radar/SE_probltg.gif * SE-US Forecast for 3 hours updated every 30 minutes
http://webflash.ess.washington.edu/ or
http://wwlln.net/
http://wwlln.net/TOGA_network_global_maps.htm
http://wwlln.net/WWLLN_movies/Movie_of_Lightning_in_Americas_BIG.gif
http://wwlln.net/one_day_density_average.jpg
http://branch.nsstc.nasa.gov/PUBLIC/LDARII/ Florida Lightning
Detection And Ranging II (LDAR II) Network [no longer updated]
http://branch.nsstc.nasa.gov/PUBLIC/LDARII/images/ * [no longer updated]
http://www.lightningmaps.org/blitzortung/america/index.php?bo_page=map&bo_showmap=usa&lang=en&bo_period=0
http://www.lightningmaps.org/blitzortung/america/index.php?bo_page=map&bo_period=0&bo_showmap=florida_big&lang=en
http://www.blitzortung.org/Webpages/index.php?lang=en®ion=3&subpage_0=30
http://images.blitzortung.org/Images/image_b_us.png
http://www.blitzortung.org/Webpages/index.php?lang=en®ion=3&subpage_0=32 Florida
http://images.blitzortung.org/Images/image_b_fl.png
http://ghrc.nsstc.nasa.gov/ghrc/data/pub-browse-link/surface/lightning/gif-inst/?M=D
or http://ghrc.nsstc.nasa.gov/browse/surface/lightning/gif-inst/?M=D
[stopped correctly updating
02/15/07] Current Cloud-to-Ground
Lightning Strikes every 15 minutes
http://ghrc.nsstc.nasa.gov/ghrc/data/pub-browse-link/surface/lightning/gif-daily/?M=D
or http://ghrc.nsstc.nasa.gov/browse/surface/lightning/gif-daily/?M=D
[stopped updating 12/31/07]
Current Cloud-to-Ground
Lightning Strikes every 15 minutes
https://avweb.weather.navy.mil/cgi-bin/loop/loop.cgi?/var/www_navy/leads_images/lightning/SER/
[censored]
https://ows.barksdale.af.mil/By_Type/lightning/index.cfm?fuseaction=noaaport_lightning&lightning_type=ALL®ion=CONUS&UID=&BW=H&UF=O&AOR=1
https://26ows.barksdale.af.mil/index.cfm?fuseaction=get_link&look_id=10351 [censored]
https://ows.barksdale.af.mil/NORTHCOM/index.cfm?fuseaction=noaaport_lightning®ion=SOUTHEAST&UID=&BW=H&UF=O&AOR=1
https://26ows.barksdale.af.mil/NORTHCOM/index.cfm?fuseaction=get_link&look_id=14553 [censored]
http://weather.noaa.gov/pub/data/raw/sf/sfus41.kwbc..txt [latest inside US NLDN encrypted and encoded binary
format]
http://weather.noaa.gov/pub/data/raw/sf/sfpa41.kwbc..txt [latest outside US pacific region NLDN encrypted and
encoded binary format]
The products below are at
least 30 minutes delayed and lack detail!
The lack of timeliness, resolution and manner in which this
lightning data is displayed does not support effective or
reliable use of the data in making decisions of an immediate or
short term nature that involve the safety of people or material.
http://www.uspln.com/
http://www.uspln.com/images/napln_animated.gif *
http://www.uspln.com/images/gln_animated.gif
http://www.accuweather.com/maps-lightning.asp?partner=accuweather&traveler=0&zipcode=
http://sirocco.accuweather.com/adc_images/lightning/us_60_640x480.gif *
http://sirocco.accuweather.com/adc_images/lightning/us_90_640x480.gif
http://sirocco.accuweather.com/adc_images/lightning/us_120_640x480.gif
http://sirocco.accuweather.com/adc_images/lightning/us_150_640x480.gif
http://weather.weatherbug.com/lightning.html
http://radarimg.weatherbug.com/images/lightning/LxEnlarge1.jpg [1 to 10.jpg] add ? mark at link end for every 10
minute update
http://radarimg.weatherbug.com/images/lightning/SELxEnlarge1.jpg [1 to 10.jpg]
http://radarimg.weatherbug.com/images/lightning/SCLxEnlarge1.jpg [1 to 10.jpg]
http://radarimg.weatherbug.com/images/lightning/SWLxEnlarge1.jpg [1 to 10.jpg]
http://radarimg.weatherbug.com/images/lightning/NELxEnlarge1.jpg [1 to 10.jpg]
http://radarimg.weatherbug.com/images/lightning/NCLxEnlarge1.jpg [1 to 10.jpg]
http://radarimg.weatherbug.com/images/lightning/NWLxEnlarge1.jpg [1 to 10.jpg]
http://thunderstorm.vaisala.com/explorer.html lacks detail and
30 minutes delayed
http://thunderstorm.vaisala.com/explorer_files/lts-image.jpg lacks detail and
30 minutes delayed
http://thunderstorm.vaisala.com/threatMap.html or
http://www.weatheroffice.gc.ca/lightning/index_e.html
http://thunderstorm.vaisala.com/explorer_files/ltsUS.png
http://www.intellicast.com/Storm/Severe/Lightning.aspx
http://images.intellicast.com/WxImages/Lightning/usa.jpg
http://image.weather.com/images/maps/severe/map_light_ltst_4namus_enus_600x405.jpg *
http://www.wunderground.com/radar/radblast.asp?zoommode=pan&prevzoom=zoom&num=6&frame=0&delay=15&scale=1.000&noclutter=0&ID=TBW&type=N0Z&showstorms=0&lat=0&lon=0&label=you&map.x=400&map.y=240&scale=1.000¢erx=400¢ery=240&showlabels=1&rainsnow=0&lightning=1&lerror=20&num_stns_min=2&num_stns_max=9999&avg_off=9999&smooth=0 [Tampa FL Radar set lightning=1] it uses questionable strikestarus
lightning data
_
http://www.strikestarus.com/FREE/strikestar60.png
http://www.strikestarus.com/FREE/SEUS60.png
http://www.strikestarus.com/FREE/SCUS60.png
http://www.strikestarus.com/FREE/SWUS60.png
http://www.strikestarus.com/FREE/NEUS60.png
http://www.strikestarus.com/FREE/NCUS60.png
http://www.strikestarus.com/FREE/NWUS60.png
http://www.aprsfl.net/weather/lightning/
http://arlingtonweather.net/lightning/nexstorm.png
http://arlingtonweather.net/lightning/wasp2.png
http://www.rivercityweather.net/lightning/wasp2.png
http://www.flamedia.com/light2.jpg
http://www.flamedia.com/light3.jpg
http://n4gxx.org/NexStorm/StormVue.html
http://www.lightningnetwork.org/lightning/
http://www.astrogenic.com/imgmap/nxonline_na.html ?
http://www.lightningtracker.com/ ? These lightning products do not have much accuracy!
http://www.aninoquisi.com/live_lightning1.htm These
lightning products do not have much accuracy!
The Automated Lightning Detection and
Reporting System (ALDARS) collects lightning stroke information
from the National Lightning Detection Network (NLDN) and
disseminates this data to AWOS/ASOS for the reporting of
thunderstorms in METAR or SPECI observations, when appropriate.
Incorporated into the ASOS METAR and SPECI reports in the
standard METAR format:
TS - Within 5 mi. of the airport
VCTS - 5 to 10 miles from the airport
LTGDSNT DIR - 10-30 miles from the airport ("DIR" is
the direction from the airport)
Go to Florida
METAR/SPECI
http://thunder.msfc.nasa.gov/ NLDN restricted
http://thunder.msfc.nasa.gov/cgi-bin/lis/lisnqc_cal.pl TRMM satellite
Worldwide lightning map from data obtained from
April 1995 to March 2000 from NASA's Optical Transient Detector;
and from December 1997 to November 2000 from NASA's Lightning
Imaging Sensor (LIS).
http://science.nasa.gov/headlines/y2001/ast05dec_1.htm
http://earthobservatory.nasa.gov/Newsroom/NewImages/images.php3?img_id=6254
http://www.msfc.nasa.gov/news/NSSTC/news/releases/2002/N02-001.html
http://www.lightningsafety.noaa.gov/ and http://www.lightningsafety.com/nlsi_pls.html Personal Lightning Safety
http://www.nws.noaa.gov/om/wcm/lightning/index.htm
http://www.crh.noaa.gov/pub/ltg.html Colorado Lightning Resource Center
_
http://www.srh.noaa.gov/mlb/ltgcenter/ltgmain.html Florida Lightning Statistics
Lightning ranks at the top in weather-related deaths in the State of Florida!
National Lightning Detection Network (NLDN)
The National Weather Service and others cannot allow public access to NLDN data [paid for by taxes] from Vaisala lightning-sensor networks because of bad restrictions written in government contracts. Vaisala, Inc. (now a foreign-owned company formerly Global Atmospherics, Inc. or GAI) [https://thunderstorm.vaisala.com/] got a taxpayer funded government contract that is not shared with the taxpayers. That means there is no regard to public-safety when government allows its resources to be restricted.
A contractor, Vaisala Inc. (now a foreign-owned company formerly Global Atmospheric Incorporated GAI), operates antenna-station lightning-detection sensors covering the United States and a 200-300km area of coastal waters. These sensors make up the National Lightning Detection Network (NLDN). By triangulation and computing different times of arrival of lightning strikes they are able to locate cloud-to-ground lightning strikes to an accuracy of 1/4 of a mile.
While the sensors detect cloud-to-cloud flashes they are unable to accurately locate them. Cloud-to-cloud strikes are not reported. The NLDN detects 80 to 90% of all cloud-to-ground lightning strokes.
The
United States Air Force https://weather.afwa.af.mil/ was more
open to the public on the Internet in the 1990s. By year 2000, a
few U.S. Air Force commanders decided to use passwords completely
blocking America's public access. They have restricted NLDN
products if you get access to the Air Force Weather Agency.
You, the taxpayer, pay for restricted government resources that
are often better than commercially available products!
The Freedom of Information Act (FOIA) could use revisions for
better government openness, but President Bush's administration
is going the opposite direction.
https://weather.afwa.af.mil/lightning_applet/lightning.html
The United States Navy https://avweb.weather.navy.mil/lightning/ began censorship of NLDN products in 2005.
There are future needs for geosynchronous-orbit satellites capable of detecting real-time transient lightning events and real-time data free to the public. Lightning burst signatures could provide an average of 9 minutes additional lead-time before radar signatures of severe storm warnings. High-low-high pulses in flash rates would indicate developing tornadic storms.
Tornadic thunderstorms produce a well-defined peak-lull-peak pulsing flash rate with the most significant amplitudes occurring during the 20-minute period before the time of the first tornado touchdown. The maximum total lightning rate occurs during the developing tornadic supercell phase. Cloud to ground flash polarity tends to shift from +CG and decrease in flash rate coincident with a tornado touchdown then shift to -CG. Thunderstorms dominated by +CG flashes will have some rotation.
Hurricanes do not produce as much lightning as mid-latitude systems because they contain smaller amounts of supercooled water due to relatively low vertical velocities.
http://www.nwstc.noaa.gov/METEOR/Lightning/Ltng_home.htm NWS Intern Training Lightning Information
http://www.nwstc.noaa.gov/nwstrn/d.ntp/meteor/istpcu2.html NWS
Integrated Sensor Training Using Lightning Observations
http://www.google.com/search?num=100&q=lightning-detector
Aviation Weather
_
http://aviationweather.gov/ or
http://weather.aero/
http://aviationweather.gov/adds/
?https://www4.nlmoc.navy.mil/aviation/lp1new.html
http://www.rap.ucar.edu/weather/surface/ METARS and
Surface Plots
http://www.rap.ucar.edu/largedrop/national.html Real-time
Aircraft Icing Data
http://www.weather.gov/view/validProds.php?prod=TAF
http://weather.noaa.gov/weather/taf.shtml TAF
http://www.apo.data.faa.gov/faatafall.HTM java TAF
http://www-frd.fsl.noaa.gov/mab/metar/ javascript
java Zoom-in map of current
METARS and surface plots
http://www.faa.gov/asos/map/map.htm Automated Weather
Observing map of States with click-on tables
http://weather.noaa.gov/weather/metar.shtml METARS
http://weather.noaa.gov/weather/coded.html METARS
http://weather.noaa.gov/pub/data/observations/metar/cycles/?M=D METARS past
hourly
http://www.wrcc.dri.edu/cgi-bin/saohtml_pl METARS
https://avweb.weather.navy.mil/aviation/html/decoded.shtml?SYS (Censored)
http://zowie.metnet.navy.mil/cgi-bin/oleg/get-obs METARS
http://www.metnet.navy.mil/cgi-bin/oleg/get-uar RAOB/PIREP/AIREP/AMDA
http://www.usgodae.org/docs/fgge/ formats RAOB/PIREP/AIREP/AMDA
http://meteora.ucsd.edu/weather/observations/metar/ METARS
http://meteora.ucsd.edu/weather/observations/upperair/ PIREP reports UBFL90 KWBC or UBUS1 KNKA or UBUS31 KWBC
http://www.met.fsu.edu/rawdata/aircraft/ raw AIREP AMDAR
reports
http://weather.noaa.gov/pub/SL.us008001/DF.an/DC.sluan/?C=M;O=D raw AIREP AMDAR
reports
http://weather.noaa.gov/pub/SL.us008001/DF.an/DC.sflnd/?C=M;O=D raw METAR TAF
reports
http://weather.noaa.gov/pub/data/raw/ua/?C=M;O=D AIREP AMDAR
reports
http://weather.noaa.gov/pub/data/raw/ua/uaus31.kwbc..txt
http://weather.noaa.gov/pub/data/raw/ub/?C=M;O=D PIREP reports
http://www.arl.noaa.gov/ready-bin/getwx1.pl US surface plots
http://www.aos.wisc.edu/weatherdata/sfc/sfc_us_map.gif US surface plots
or http://mapmaker.meteor.wisc.edu/~wxp/sfc/sfc_us_map.gif (alternative)
US surface plots
http://weather.unisys.com/surface/sfc_map.html US surface plots
http://weather.unisys.com/surface/sfc_depict.html
http://ww2010.atmos.uiuc.edu/(Gh)/wx/surface.rxml
http://ww2010.atmos.uiuc.edu/wx/cwp/prods/current/sfcobs/sfcobs_N.gif US surface plots
http://ww2010.atmos.uiuc.edu/wx/cwp/prods/current/irobs/irobs_N.gif US surface plots
with isobars/IR sat
http://meteora.ucsd.edu/weather/cdf/images/us_sfc_wx_nrm.gif US surface plots
http://windfall.evsc.virginia.edu/~mcuser/webpage/obs/sfcpt.gif Surface contours
http://www.srh.noaa.gov/default2.html Center Weather Service Units (CWS) click-on Map
http://www.aos.tc.faa.gov/AOS500/AOS540/afss.htm Automated Flight Service Stations
_
http://www.ncdc.noaa.gov/oa/climate/conversion/mppconversion.html Conversion and
Decoder Charts
http://www.ncdc.noaa.gov/oa/climate/conversion/swometardecoder.html METAR decoder
http://www.nws.noaa.gov/om/brochures.shtml
http://www.nws.noaa.gov/om/brochures/pilot.htm A Pilot's Guide
to Aviation Weather Services
http://www.nws.noaa.gov/oso/oso1/oso12/document/guide.shtml KEY to TAF and METAR
http://www.nws.noaa.gov/om/brochures/asosbook.htm Automated Surface
Observing System GUIDE FOR PILOTS
http://www.nws.noaa.gov/directives/010/010.htm NDS 10-8 Aviation Weather Services
http://www.faa.gov/avr/afs/ and http://av-info.faa.gov/
http://www.faa.gov/ATpubs/
http://www.faa.gov/ATpubs/SWO/ SURFACE WEATHER OBSERVING
http://www.star.nesdis.noaa.gov/smcd/opdb/aviation/ GOES enhanced images
http://image.weather.com/images/maps/aviation/avifr_720x486.jpg
http://image.weather.com/images/maps/aviation/air_turb_pot_720x486.jpg
http://image.weather.com/images/maps/aviation/air_ice_pot_720x486.jpg
http://image.weather.com/images/maps/aviation/mtn_obs_pot_720x486.jpg
http://image.weather.com/images/maps/aviation/airport_impact_default_720_usen.jpg
http://image.weather.com/images/maps/aviation/airport_impact_am_720_usen.jpg
http://image.weather.com/images/maps/aviation/airport_impact_midday_720_usen.jpg
http://image.weather.com/images/maps/aviation/airport_impact_pm_720_usen.jpg
Space Weather
There is a theory that axis pole-shifts occur every 780,000
years. It could be caused by a cyclic cosmic force that causes
mass extinctions. The theory is that as are solar system moves
around the galaxy and around a black hole we pass through a force
field that triggers a change in the Earth's axis. That would
cause severe climate change, violent earthquakes, mega tsunamis,
super volcanic eruptions, deformation of the Earth's crust, great
floods, solar eruptions, loss of the stratosphere, and mass
extinctions. More likely are geomagnetic reversals that do not
cause mass extinctions but could greatly reduce the human
population with similar catastrophes. The bad news is that a
geomagnetic reversal would happen soon since time is due for it.
This might allow cosmic radiation to increase causing extinctions
on Earth since there is new scientific evidence of extinctions on
Earth every 62 million years caused by cosmic radiation. The good
news is a pole-shift is an unproven theory.
A gamma ray burst originating in our Milky Way, within a
thousand light years or so, could lead to mass extinction on
earth. Gamma rays interacting in the earth's atmosphere would
burn away the ozone layer, allowing deadly ultraviolet radiation
to penetrate through the atmosphere. The influx of radiation
would lead to widespread cancer and other diseases.
http://www.google.com/search?num=100&as_epq=Earth+pole+shift&as_sitesearch=.edu
http://www.google.com/search?num=100&q=Earth+pole-shift
http://www.google.com/search?num=100&as_epq=Earth+geomagnetic+reversal&as_sitesearch=.edu
http://www.google.com/search?num=100&q=Earth+geomagnetic+reversal
http://www.google.com/search?num=100&q=Earth+cosmic-radiation+extinctions
_
http://www.swpc.noaa.gov/ javascript
http://www.swpc.noaa.gov/SWN/ Space Weather Now
http://www.swpc.noaa.gov/alerts/ Space Weather
Alerts
http://www.swpc.noaa.gov/advisories/ Space Weather
Advisories
http://www.swpc.noaa.gov/Data/ Space Weather Data and Products
http://www.swpc.noaa.gov/ftpdir/
http://www.swpc.noaa.gov/ftpdir/latest/wwv.txt Geophysical Alert
Message
http://www.swpc.noaa.gov/Services/
http://www.swpc.noaa.gov/radio/ SEC's Radio User's Page
http://www.swpc.noaa.gov/Education/
http://www.swpc.noaa.gov/NOAAscales/ Scale coding
http://sohowww.nascom.nasa.gov/ Solar and Heliospheric Observatory
http://lasco-www.nrl.navy.mil/javagif/
http://stereo-ssc.nascom.nasa.gov/spaceweather.shtml
http://geomag.usgs.gov/
http://www.ava.fmi.fi/spee/realtime.html Shortcuts to near real time solar-terrestrial data
plots
http://www.n3kl.org/
http://www.haarp.alaska.edu/haarp/data.fcgi
http://solarscience.msfc.nasa.gov/SXI.shtml GOES-12 Solar X-ray Imager
http://www-istp.gsfc.nasa.gov/istp/events/monitor/
http://www.gong.noao.edu/
http://www.spacew.com/
http://solar.uleth.ca/ (alternative)
http://www.spaceweather.com/
http://solar-b.nao.ac.jp/index_e.shtml
http://www.ips.gov.au/Space_Weather
http://www.ngdc.noaa.gov/stp/IONO/ionohome.html
ftp://jwocky.gsfc.nasa.gov/pub/eptoms/images/
http://www.cpc.ncep.noaa.gov/products/stratosphere/
http://www.esrl.noaa.gov/ Surface Radiation Research Branch
http://www.esrl.noaa.gov/gmd/grad/solcalc/ Sunrise/Sunset
Calculator
http://www.usno.navy.mil/USNO/astronomical-applications Astronomical Applications
http://www.usno.navy.mil/USNO/astronomical-applications/data-services Astronomy Data
http://www.usno.navy.mil/USNO/astronomical-applications/data-services/rs-one-day-us Complete Sun and Moon Data for One Day
http://websurf.hmnao.com/ Her Majesty's Nautical Almanac Office
http://www.fourmilab.ch/ or http://www.fourmilab.to/
http://www.fourmilab.ch/earthview/ Earth and Moon
Viewer
http://www.fourmilab.ch/earthview/satellite.html
http://www.fourmilab.ch/yoursky/
http://www.fourmilab.ch/solar/
Ultraviolet Forecasts
Depletion of
stratospheric ozone is an urgent environmental and public health
problem because the ozone layer provides critical protection from
solar UV radiation for life on the earth's surface. Skin cancer
is the most common form of cancer in the U.S., accounting for 50%
or more of all cancers. Rates of melanoma, the deadliest form of
skin cancer, have increased 3-6% a year over the last 30 years,
and the National Cancer Institute reports that incidence of
melanoma has doubled since the mid-1970's, when the ozone hole
was identified. In 2004, the American Cancer Society estimates
over 59,000 new melanomas will be diagnosed, and over 10,000
deaths will occur due to melanoma.
_
http://www.cpc.ncep.noaa.gov/products/stratosphere/uv_index/
http://www.cpc.ncep.noaa.gov/products/stratosphere/uv_index/uv_current.shtml UV forecast
http://www.cpc.ncep.noaa.gov/products/stratosphere/uv_index/uv_current_map.shtml UV forecast map
http://www.weather.gov/view/validProds.php?prod=UVI&node=KWBC
http://www.ready.noaa.gov/ready-bin/uv.pl (alternative)
http://asp1.sbs.ohio-state.edu/text/station/KWBC/AEUS41.KWBC (alternative)
http://www.accuweather.com/maps-health.asp?partner=accuweather&traveler=0&zipcode=&type=uvi
http://www.wunderground.com/US/Region/US/UVForecast.html
http://icons.wunderground.com/data/640x480/2xus_uv.gif
http://icons.wunderground.com/data/images/us_uv.gif
http://image.weather.com/images/maps/boat-n-beach/fl_fcst_uv_720x486.jpg
http://www.wxresearch.com/usuv.gif
http://uv.colorado.edu/monitoring.html UV Monitoring Around the World
Ozone
The ozone layer shields earth
from excessive ultraviolet (UV) radiation that causes skin cancer,
cataracts, and immune suppression. Stratospheric ozone has
decreased 3% globally between 1980 and 2000 and thins by 50% over
Antarctica in winter and spring.
_
http://ozonewatch.gsfc.nasa.gov/
http://toms.gsfc.nasa.gov/ozone/today.html
http://science.larc.nasa.gov/research.html
http://tes.jpl.nasa.gov/mission/O3SourceSink/
http://aura.gsfc.nasa.gov/instruments/omi.html
http://www.cpc.ncep.noaa.gov/products/stratosphere/ Ozone
http://www.ozonelayer.noaa.gov/
http://www.epa.gov/ozone/
http://disc.sci.gsfc.nasa.gov/PIP/shtml/ozone.shtml
http://www.osdpd.noaa.gov/ml/air/
http://www.star.nesdis.noaa.gov/star/
http://exp-studies.tor.ec.gc.ca/e/ozone/Curr_allmap_g.htm
http://www.wmo.int/pages/prog/arep/index_en.html
http://wdc.dlr.de/sensors/index.html links to World data of remote sensing of the atmosphere
http://www.atmosp.physics.utoronto.ca/SPARC/index.html Stratospheric Processes And their Role in Climate
chemistry
Gamma-Ray Burst
WR-104 is in our galaxy and it
will go supernova. It appears the polar axis could be aimed at
Earth, which could aim a gamma-ray burst (GRB) that could destroy
the Earth's ozone causing mass life extinction. Today's science
is still uncertain about GRBs because they were recently
discovered in the 1960s, so they are not certain that WR-104 will
result in a deadly GRB to hit Earth.
http://www.google.com/search?num=100&q=WR-104
http://swift.gsfc.nasa.gov/
or http://heasarc.gsfc.nasa.gov/docs/swift/swiftsc.html
or http://swift.sonoma.edu/
http://gcn.gsfc.nasa.gov/burst_info.html
http://glast.gsfc.nasa.gov/
http://glast.gsfc.nasa.gov/science/grbst/links.html
http://batse.msfc.nasa.gov/gbm/
http://grb.sonoma.edu/
http://grad40.as.utexas.edu/
http://glast.sonoma.edu/
http://glast.stanford.edu/
Near-Earth Object Hazards
_
If a big enough asteroid or comet struck the ocean it would
unleash a "mega tsunami" or giant tidal wave that could
reach around the entire globe, inundating millions of acres of
land, destroying coastal habitations and killing perhaps millions
of people.
If it hit land it could completely destroy an area the size of
Europe and would raise enough dust into the atmosphere to change
the climate of the planet completely, causing a mini ice age that
would freeze crops, destroy plant life and start a global famine.
It would also completely destroy the ozone layer.
Many scientists estimate the impact by a
single object 3000 feet in diameter could kill up to a quarter of
our planet's population. Theories say that an asteroid is what
caused the dinosaur extinction.
http://impact.arc.nasa.gov/ - http://impact.arc.nasa.gov/torino/prof.html http://impact.arc.nasa.gov/torino/
http://neo.jpl.nasa.gov/
http://neo.jpl.nasa.gov/news/
http://neo.jpl.nasa.gov/risk/ - http://neo.jpl.nasa.gov/torino_scale.html
http://neo.jpl.nasa.gov/neo/pha.html Potentially Hazardous Asteroids
http://ssd.jpl.nasa.gov/
http://echo.jpl.nasa.gov/
http://neat.jpl.nasa.gov/
http://nssdc.gsfc.nasa.gov/planetary/planets/asteroidpage.html
http://www.nasa.gov/mission_pages/hubble/ - http://hubble.nasa.gov/news/latest.php
http://www.hohmanntransfer.com/
http://tech.groups.yahoo.com/group/mpml/ The Minor Planet Mailing List {MPML)
http://www.minorplanetcenter.org/mpec/RecentMPECs.html
http://cfa-www.harvard.edu/cfa/ps/TheIndex.html
http://cfa-www.harvard.edu/iau/NEO/TheNEOPage.html
http://cfa-www.harvard.edu/iau/lists/Dangerous.html
http://cfa-www.harvard.edu/cfa/ps/mpc.html
http://www.lpl.arizona.edu/css/
http://spacewatch.lpl.arizona.edu/
http://asteroid.lowell.edu/
http://pdssbn.astro.umd.edu/
http://www.mso.anu.edu.au/ Australia's Premier Centre for Astronomical Research
http://www.mso.anu.edu.au/~rmn/ Comet Discovery
http://www.nearearthobjects.co.uk/
http://spaceguard.esa.int/ or http://spaceguard.rm.iasf.cnr.it/ - http://spaceguard.esa.int/NScience/neo/neo-when/impact-torino.htm
http://spaceguard.tau.ac.il/English/indexEng.html
http://www.spaceguard.or.jp/index_e.html
http://www.spaceguarduk.com/
http://www1.tpgi.com.au/users/tps-seti/spacegd.html
http://www.spaceguardindia.com/
http://earn.dlr.de/nea/
http://hamilton.dm.unipi.it/cgi-bin/astdys/astibo or http://newton.dm.unipi.it/cgi-bin/neodys/neoibo
http://www.astro.uu.se/planet/
http://www.brera.mi.astro.it/sormano/
http://www.planetary.org/explore/topics/asteroids_and_comets/
more Space links
Air
Quality
_
http://www.epa.gov/bpspill/air.html Gulf of Mexico oil spill
http://airnow.gov/
http://cfpub.epa.gov/airnow/index.cfm?action=airnow.main
http://wwwt.emc.ncep.noaa.gov/mmb/aq/
http://www.weather.gov/aq/
http://raqms-ops.ssec.wisc.edu/ Realtime Air Quality Modeling System
http://www.dep.state.fl.us/air/air_quality/airdata.htm Florida's Ozone Network
http://www.nrlmry.navy.mil/aerosol/ World Aerosal
Conditions
http://www.nrlmry.navy.mil/flambe/images/products/globaer_plots/
http://www.nrlmry.navy.mil/flambe/images/products/smoke_flux/latest.gif
http://jwocky.gsfc.nasa.gov/aerosols/today_aero.html Aerosol
Conditions
http://aeronet.gsfc.nasa.gov/
http://www.osdpd.noaa.gov/PSB/EPS/Aerosol/Aerosol.html
http://oceancolor.gsfc.nasa.gov/
http://oceancolor.gsfc.nasa.gov/cgi/browse.pl?prm=TC dust
http://www.arl.noaa.gov/ready/aq.html
http://vista.cira.colostate.edu/views/
http://nadp.sws.uiuc.edu/airmon/GetAMdata.asp
http://www.esrl.noaa.gov/
http://www.arl.noaa.gov/research/projects/airmon_data.html
ftp://www.arl.noaa.gov/pub/web/trajectory/airmon/
http://www.epa.gov/
http://www.epa.gov/ebtpages/emergencies.html
http://www.epa.gov/swercepp/ Chemical
Emergency Preparedness and Prevention Office
http://www.arl.noaa.gov/ready/hysplit4.html restricted after
9/11 Transport and
Dispersion from Models
http://www.arl.noaa.gov/ready/er.html Emergency
response
http://www.accuweather.com/maps-health.asp?partner=accuweather&traveler=0&zipcode=&type=airq
http://image.weather.com/images/maps/health/airquality/us_national_fcst_airquality_day1_600_en.jpg
http://image.weather.com/images/maps/health/airquality/us_ne_fcst_airquality_day1_600_en.jpg
http://image.weather.com/images/maps/health/airquality/us_se_fcst_airquality_day1_600_en.jpg
http://image.weather.com/images/maps/health/airquality/us_ncal_fcst_airquality_day1_600_en.jpg
http://image.weather.com/images/maps/health/airquality/us_scal_fcst_airquality_day1_600_en.jpg
http://image.weather.com/images/maps/health/forresp_720x486.jpg
http://image.weather.com/images/maps/health/influenz_720x486.jpg
http://image.weather.com/images/maps/health/grass_pol_720x486.jpg
http://image.weather.com/images/maps/health/tree_pol_720x486.jpg
http://image.weather.com/images/maps/health/rag_pol_720x486.jpg
http://image.weather.com/images/maps/health/mold_spore_720x486.jpg
http://image.weather.com/images/maps/health/foraches_720x486.jpg
http://icons.wunderground.com/data/640x480/2xus_pollen.gif
http://icons.wunderground.com/data/images/us_pollen.gif
http://www.wunderground.com/US/Region/US/2xFlu.html
http://icons.wunderground.com/data/640x480/2xus_flu_anim.gif
http://icons.wunderground.com/data/640x480/2xus_flu.gif
Fire Weather
_
http://www.nifc.gov/information.html Current Wildland
Fire Information
http://activefiremaps.fs.fed.us/ Maps
http://www.wfas.net/ Wildland Fire Assessment System Maps
http://www.wfas.us/content/view/16/31/
http://www.fs.fed.us/news/fire/
http://www.fs.fed.us/psw/topics/fire_science/
http://www.fs.fed.us/psw/topics/fire_science/fire_weather/
http://www.fs.fed.us/psw/topics/fire_science/fire_weather/mfwf/MFWF.shtml Monthly Fire
Weather Forecast
http://landfire.cr.usgs.gov/viewer/ javascript
http://www.srh.noaa.gov/srh/cwwd/msd/firewx/
http://www.weather.gov/wwamap-prd/wwatxtget.php?cwa=usa&wwa=dense%20smoke%20advisory Dense Smoke Advisory
http://www.weather.gov/wwamap-prd/wwatxtget.php?cwa=usa&wwa=red%20flag%20warning Red Flag Warning
http://www.weather.gov/wwamap-prd/wwatxtget.php?cwa=usa&wwa=fire%20weather%20watch Fire Weather Watch
http://fire.boi.noaa.gov/ Click-on map of
daily fire weather forecast from NWS offices across the nation
http://www.spc.noaa.gov/products/fire_wx/
http://www.spc.noaa.gov/exper/firecomp/ Experimental graphics
http://ecpc.ucsd.edu/projects/fire.html Fire Severity
Project
http://www.arl.noaa.gov/smoke/forecast.html
ftp://www.arl.noaa.gov/pub/web/fires/
ftp://www.arl.noaa.gov/pub/web/trajectory/
http://www.ssd.noaa.gov/PS/FIRE/ Satellite fire
detection older images; sometimes shows Florida
http://www.ssd.noaa.gov/PS/FIRE/GASP/gasp.html GOES Aerosol/Smoke Product (GASP)
http://cimss.ssec.wisc.edu/goes/burn/wfabba.html
http://www.nrlmry.navy.mil/flambe/ Fire Locating and
Modeling of Burning Emissions
http://www.nrlmry.navy.mil/flambe/images/products/flambe_flux/latest.gif
http://www.star.nesdis.noaa.gov/smcd/emb/vci/ Vegetation Health Index
http://www.osdpd.noaa.gov/PSB/IMAGES/gvi.html Global Vegetation Index
http://www.osei.noaa.gov/Events/Fires/ Older satellite
images
http://radar.weather.gov/ Radar can show
big smoke plums
Drought
_
http://www.drought.gov/
http://www.nws.noaa.gov/oh/hic/current/drought/ Drought statements
http://www.srh.noaa.gov/srh/ssd/html/drought.htm
http://www.cpc.ncep.noaa.gov/products/monitoring_and_data/drought.shtml
http://www.cpc.ncep.noaa.gov/products/analysis_monitoring/regional_monitoring/palmer.gif Drought Severity map
http://www.cpc.ncep.noaa.gov/products/analysis_monitoring/regional_monitoring/cmi.gif Crop Moisture map
http://www.cpc.ncep.noaa.gov/products/predictions/threats/briefs/brief14.html United States
Hazards Assessment: Drought/Wildfire
http://www.cpc.ncep.noaa.gov/products/predictions/threats/s_threats.gif
http://www.cpc.ncep.noaa.gov/products/expert_assessment/drought_assessment.shtml
http://www.cpc.ncep.noaa.gov/products/Soilmst_Monitoring/ Soil Moisture
Monitoring
http://wxmaps.org/pix/soil1.html 14-day Soil
Moisture Outlook
http://www.wfas.net/ Moisture & Drought
http://www.drought.unl.edu/monitor/monitor.htm
http://www.drought.unl.edu/dm/
http://www.drought.unl.edu/dm/monitor.html U.S. Drought maps
http://www.drought.unl.edu/dm/current.html Combination of
Drought maps
http://www.drought.unl.edu/dm/forecast.html U.S. Drought
Forecast maps
http://www.drought.unl.edu/monitor/currspi.htm Standardized Precipitation Index
http://www.drought.unl.edu/risk/us/usimpacts.htm Drought Impacts
http://www.drought.unl.edu/monitor/tools.htm
http://water.usgs.gov/
http://water.usgs.gov/cgi-bin/dailyMainW?state=us&map_type=dryw&web_type=map Drought Watch
http://image.weather.com/images/maps/special/soilmoist_720x486.jpg
http://image.weather.com/images/maps/current/palmer_drought_720x486.jpg
Earthquakes
_
http://earthquake.usgs.gov/
http://earthquake.usgs.gov/eqcenter/
http://earthquake.usgs.gov/eqcenter/recenteqsus/Quakes/quakes_big.php
http://gldss7.cr.usgs.gov/current_data.html
http://gldss7.cr.usgs.gov/neis/data_services/ftp_files.html
http://geohazards.cr.usgs.gov/
http://geohazards.cr.usgs.gov/research.php
http://quake.wr.usgs.gov/
http://www.weather.gov/view/national.php?prodtype=earthquake
http://www.weather.brockport.edu/cgi-bin/earthquake?time=Latest
http://www.weather.brockport.edu/cgi-bin/earthquake?time=Today
http://www.weather.brockport.edu/cgi-bin/earthquake?time=Yesterday
http://www.iris.edu/hq/ IRIS - Incorporated Research Institutions for
Seismology
http://www.iris.washington.edu/quakes/quakes.htm
http://www.ceri.memphis.edu/
http://www.seismo.ethz.ch/
http://www.seismo.ethz.ch/redpuma/redpuma_ami_list.html Rapid earthquake data
http://www.seismo.ethz.ch/redpuma/redpuma_plus6_list.html
http://www.seismo.ethz.ch/redpuma/maps/worldmap.html
http://www.gfz-potsdam.de/geofon/
http://geofon.gfz-potsdam.de/db/eqinfo.php
http://image.weather.com/images/maps/special/usa_earth_720x486.jpg
http://image.weather.com/images/maps/special/ak_earth_720x486.jpg
http://image.weather.com/images/maps/special/nw_earth_720x486.jpg
http://image.weather.com/images/maps/special/scal_earth_720x486.jpg
http://image.weather.com/images/maps/special/ncal_earth_720x486.jpg
http://www.geophys.washington.edu/seismosurfing.html
http://www.geolsoc.org.uk/template.cfm?name=links links for geoscientists
http://directory.google.com/Top/Science/Earth_Sciences/Geophysics/Earthquakes/
http://dir.yahoo.com/Science/Earth_Sciences/Geology_and_Geophysics/Seismology/
http://dmoz.org/Science/Earth_Sciences/Geophysics/Earthquakes/
http://www.fema.gov/hazard/earthquake/index.shtm
Earthquake Prediction
Beware of prediction errors without verification!
http://www.quakeprediction.com/
http://www.syzygyjob.org/
http://www.syzygyjob.net/jackcoles/
http://www.syzygyjob.net/prediction/messages.html
http://www.syzygyjob.com/earthquakes/rqlinks.shtml
http://www.freewebz.com/eq-forecasting/
http://scec.ess.ucla.edu/%7Eykagan/predictions_index.html
http://quake.exit.com/
http://www.netlaputa.ne.jp/~gfg/jisin.html#001
http://earthquake.itgo.com/today.htm
http://www.weatherscope.ca/EarthquakeForecasts.asp
http://www.yatsugatake-eorc.org/ fax-only predictions - Astronomer Yoshio Kushida
analyzing radio wave flux from a number of FM stations across the
country, believes he has found five basic wave patterns that
appear several days before a major earthquake.
http://www.quakefinder.com/links.htm
Earth's magnetic field reversal
Did Mars lose most of its atmosphere without a protective magnetosphere
from solar wind erosion?
Volcanoes
_
http://rapidfire.sci.gsfc.nasa.gov/gallery/
http://www.osdpd.noaa.gov/ml/air/volcano.html
http://aviationweather.gov/iffdp/volc.php
http://aviationweather.gov/iffdp/volt.php
http://ready.arl.noaa.gov/READYVolcAsh.php
http://volcanoes.usgs.gov/
http://www.pnsn.org/ Pacific Northwest
http://vulcan.wr.usgs.gov/ Cascades Volcano Observatory
http://www.fs.fed.us/gpnf/ Gifford Pinchot National Forest Mount St. Helens
Updates
http://www.volcano.si.edu/ Global Volcanism Program: Worldwide Holocene Volcano
and Eruption Information
http://www.volcano.si.edu/reports/usgs/
http://gsc.nrcan.gc.ca/volcanoes/index_e.php Volcanoes of Canada
http://hvo.wr.usgs.gov/ Hawaiian Volcano Observatory
http://www.avo.alaska.edu/ Alaska Volcano Observatory
http://www.geo.mtu.edu/volcanoes/
http://www.geology.sdsu.edu/how_volcanoes_work/
http://www.intlvrc.org/ International Volcano Research Centre (INTLVRC) news
http://www.intlvrc.org/news.htm Current Eruptions
http://www.volcanolive.com/volcanolive.html Volcano news
http://www.sveurop.org/gb/menu/fr_menu.htm EUROPEAN VOLCANOLOGICAL SOCIETY Volcano news
http://www.swisseduc.ch/stromboli/livecams/index-en.html Volcanic Live Cams
http://www.stromboli.org/livecam.php Volcanic Live Cams
http://www.earthmountainview.com/volcanos.html Volcanic Live Cams
http://www.ssec.wisc.edu/data/volcano.html Volcano Satellite Imagery
http://www.star.nesdis.noaa.gov/smcd/opdb/aviation/volc.html Eastern Caribbean | Mexico | Central America | Ecuador
| Alaska |
http://earthobservatory.nasa.gov/NaturalHazards/category.php?cat_id=12
http://www.osei.noaa.gov/Events/Current/ Filename starts with VHS
Super volcanoes are potentially the
greatest hazard on Earth, the only greater threat being an
asteroid or comet impact from space. Geologists say there is a
real risk that sooner or later a supervolcano will erupt with
devastating force, sending temperatures plunging on a hemispheric
or a global scale causing massive extinctions due to a reduced
food supply. The Yellowstone super volcano in Wyoming, USA has
gone off roughly once every 600,000 years. Its last eruption was
640,000 years ago The Toba caldera in Sumatra, Indonesia last
erupted about 74,000 years ago. Both those or other super
volcanoes are overdue for eruption.
Volcanoes that produced exceedingly voluminous pyroclastic
eruptions and formed large calderas in the past 2 million years
would include Yellowstone, Long Valley in eastern California,
Toba in Indonesia, and Taupo in New Zealand. Other "supervolcanoes"
would likely include the large caldera volcanoes of Japan,
Indonesia, and South America.
http://www.google.com/search?num=100&q=super-volcano+caldera+OR+super-volcanoes+caldera
http://www.google.com/search?num=100&q=Toba+super-volcanoes
http://volcanoes.usgs.gov/yvo/ Yellowstone Volcano Observatory
http://volcanoes.usgs.gov/lvo/ Long Valley Caldera
http://vulcan.wr.usgs.gov/Volcanoes/Yellowstone/ Yellowstone Caldera
http://www.seis.utah.edu/ Utah and Yellowstone National Park
http://www.seis.utah.edu/yvo/ Yellowstone Volcano Observatory links
http://www.nps.gov/yell/ Yellowstone National Park
http://www.solcomhouse.com/yellowstone.htm
http://whyfiles.org/shorties/083giant_volc/
http://www.fema.gov/hazards/volcano/
Tsunami
_
If a big enough asteroid or comet (600 feet in
diameter or more) struck the ocean it would unleash a "mega
tsunami" or giant tidal wave that could reach around the
entire globe, inundating millions of hectares of land, destroying
coastal habitations and killing perhaps millions of people.
http://www.tsunami.noaa.gov/observations_data.html Tsunami
Observations & Data
http://wcatwc.arh.noaa.gov/eventmap.html Tsunami Warnings
and Watches
http://www.weather.gov/view/national.php?prodtype=tsunami
http://www.pmel.noaa.gov/tsunami/tsu_links.html Tsunami Links
http://www.prh.noaa.gov/itic/ International
Tsunami Information Center
http://wcatwc.gov/ WEST COAST &
ALASKA TSUNAMI WARNING CENTER
http://www.volcano.si.edu/world/volcano.cfm?vnum=1803-01-
http://www.benfieldhrc.org/ The Benfield
Greig Hazard Research Centre, Department of Geological Sciences
An eruption of the Cumbre Vieja volcano
on the island of La Palma, in the Canary Islands would cause a
mega-tsunami if a landslide occurs. Waves up to 600 feet washing
inland 50 to 100 miles. No coastline in the North Atlantic would
be spared. Britain, France, Spain and Portugal would all be badly
hit. North Africa would be hit, but the main wave would travel
west. It would storm across the Atlantic in hours, hitting the
Caribbean and Brazil. The real damage would be to the East coast
of the USA. However the next eruption may not destroy the island,
but one of the future eruptions certainly will.
http://www.benfieldhrc.org/SiteRoot/tsunamis/mega_tsunami_more.htm
http://www.fema.gov/hazards/tsunamis/
NOAA Products and Data Management
_
http://products.weather.gov/
http://www.nws.noaa.gov/com/ Communications Office - NWS Focus
http://www.nws.noaa.gov/directives/ Directives for NWS products
http://nzone.nws.noaa.gov/DirectivesTracking.nsf/
http://nzone.nws.noaa.gov/WSOM.nsf/FWSOM Weather Service Operations Manual
http://www.nws.noaa.gov/wsom/ or http://www.nws.noaa.gov/_wsom/
http://www.wdtb.noaa.gov/ Warning Decision Training Branch (WDTB)
http://www.rdc.noaa.gov/~foia/asdhome/noaacirc/ NOAA Circulars
http://www.ops1.nws.noaa.gov/ NWS Maintenance Logisitics and Acquisition Division
http://www.nwstc.noaa.gov/nwstrn/ NWS Training Center
http://www.nwstc.noaa.gov/outreach.html Acronyms
http://www.erh.noaa.gov/er/bgm/domestic_contractions.html Frequently used contractions
http://www.ofcm.gov/
http://www.ofcm.gov/homepage/text/pubs.htm
http://www.ofcm.gov/fmh-1/fmh1.htm Federal Meteorological Handbook and Decoding
http://metar.noaa.gov/ METAR is the international standard code format for
hourly surface weather observations
http://www.nws.noaa.gov/im/ Industrial Meteorology and software
http://www.nws.noaa.gov/geodata/
http://www.nws.noaa.gov/mdl/awips/index.htm
http://www.unidata.ucar.edu./staff/russ/met-standards.html
http://www.nws.noaa.gov/datamgmt/
http://www.nws.noaa.gov/datamgmt/notices.shtml Change Notices
http://www.nws.noaa.gov/datamgmt/commsid.html Communication Identifier Definition References
http://www.nws.noaa.gov/datamgmt/fos/fospage.html Family of Services Data and Products
http://www.nws.noaa.gov/om/ Office of Climate, Water, and Weather Services
http://www.nws.noaa.gov/om/notif.htm Product and Service Updates
http://www.nws.noaa.gov/om/disemsys.shtml Dissemination Services
http://205.156.54.206/tgstatus/
_
http://weather.noaa.gov/pub/data/raw/no/?C=M;O=D
http://weather.noaa.gov/pub/data/raw/no/noxx01.kwbc..txt
http://weather.noaa.gov/pub/data/raw/no/noxx10.kwbc..txt
http://weather.noaa.gov/pub/data/raw/no/nous41.kwbc.pns.wsh.txt
http://www.weather.gov/view/national.php?prod=PNS&sid=WSH
http://www.srh.noaa.gov/data/WBC/PNSWSH NOUS41 KWBC
http://kamala.cod.edu/offs/KWBC/nous41.chunk.html
http://asp1.sbs.ohio-state.edu/text/station/KWBC/NOUS41.KWBC
http://205.156.54.206/center.html NWS Office of Systems Operations
http://205.156.54.206/nwws/ NOAA Weather Wire Service
http://205.156.54.206/nwws/listings.htm
http://www.weather.gov/tg/ Telecommunication Operations Center
http://www.weather.gov/tg/cominfo.html
http://www.nws.noaa.gov/tg/general.html
http://weather.noaa.gov/tg/wmohdg.shtml
http://weather.noaa.gov/tg/dir_subset.shtml
or http://weather.noaa.gov/pub/msgdist/
http://www.nws.noaa.gov/ndm/ AWIPS National Datasets Maintenance (NDM)
http://www.nws.noaa.gov/ndm/natdatalog.html Log of recent and pending updates to the AWIPS National
Datasets
http://nws.noaa.gov/emwin/windat.htm EMWIN File Names
http://weather.noaa.gov/pub/data/products/dictionary.txt
http://dynis.dyncsc.com/contracts/nwws/
http://dynis.dyncsc.com/contracts/nwws/other/details.html
http://weather.unisys.com/noaaport/text_summary.html NOAAPORT Text Data Description
http://weather.unisys.com/wxp/Appendices/WMO_DDS.html Domestic Data Services
http://www.wmo.int/pages/prog/www/ois/Operational_Information/ WMO - IDS Operational Information Service (OIS)
http://www.wmo.int/pages/prog/www/ois/Operational_Information/InteractiveAccess/index.html Publication No.9 Volume C1 Interactive Search
ftp://www.wmo.ch/
Weather Research
_
http://www.publicaffairs.noaa.gov/
http://www.noaanews.noaa.gov/
http://www.nws.noaa.gov/pa/
http://www.lib.noaa.gov/
http://www.research.noaa.gov/
http://www.etl.noaa.gov/programs/
http://earthobservatory.nasa.gov/Newsroom/
http://www.msfc.nasa.gov/NEWSROOM/
http://science.nasa.gov/headlines/
http://www.omao.noaa.gov/ NOAA Marine and Aviation Operations
http://www.srh.noaa.gov/ Interactive map
of NWS Offices, RFC, and CWS homepages
http://www.wrh.noaa.gov/wrhq/nwspage.html Interactive map of NWS Offices
http://www-sdd.fsl.noaa.gov/MSAS/qcms_messages.html Quality Control Messages of Surface Data
http://www.rap.ucar.edu/weather/surface/stations.txt or http://aviationweather.gov/adds/metars/stations.txt World letter code station list
http://www.nws.noaa.gov/tg/siteloc.shtml Meteorological
Station Information Lookup
http://www.unidata.ucar.edu/staff/chiz/stations/stations.shtml (alternative)
http://www.weathergraphics.com/cgi-bin/code.cgi (alternative)
_
http://www5.ncdc.noaa.gov/ol/climvis/cards/get_cards_stns.html Upper-Air Station
Information Lookup
http://www.ncdc.noaa.gov/oa/climate/conversion/mppconversion.html Conversion and
Decoder Charts
http://www.srh.noaa.gov/elp/wxcalc/wxcalc.shtml
http://www.srh.noaa.gov/oun/severewx/branick2.html Glossary of
Weather Terms for Storm Spotters
http://www.ncdc.noaa.gov/oa/climate/climateresearch.html
http://www.ncdc.noaa.gov/oa/climate/research/monitoring.html
http://www.ncdc.noaa.gov/oa/climate/climateproducts.html US Climatic Summaries
http://www4.ncdc.noaa.gov/cgi-win/wwcgi.dll?wwAW~MP~F Most Popular Free Products
http://nndc.noaa.gov/?http://ols.nndc.noaa.gov:80/plolstore/plsql/olstore.prodspecific?prodnum=C00095-PUB-A0001 Comparative Climatic Data
http://www.srh.noaa.gov/mlb/climatology.html
http://www.srh.noaa.gov/mlb/climat/records/ Normals & Extremes for selected east central
Florida cities
http://www.esdim.noaa.gov/noaaserver-bin/NOAAServer?stype=home environmental databases
http://www.msc-smc.ec.gc.ca/climate/climate_normals/index_e.cfm Canadian Climate Normals
http://www.msc-smc.ec.gc.ca/climate/climate_normals_1990/ Canadian Climate Normals
http://www.weather.com/weather/climatology/monthly/32801
http://www.weather.com/weather/climatology/daily/32801
http://www.usps.com/cgi-bin/zip4/ctystzip2 USPS City State / ZIP Code Associations
Global Climate Change
Changes in ozone, carbon dioxide,
methane, nitrous oxide, cloud cover, water vapor and aerosols all
contribute to climate change. The melting of the polar ice capes
could be due to reduced ozone. Too much UV-B radiation from lack
of ozone protection could harm or kill microscopic algae
disrupting the aquatic food chain and impair the ocean's ability
to remove carbon dioxide from the atmosphere thus contributing to
climate change! Also, amphibians (frogs, toads, etc.),
butterflies, and bees are sensitive to ultraviolet radiation.
_
http://www.google.com/search?num=100&as_q=ocean&as_epq=climate+change&as_sitesearch=.edu
http://www.google.com/search?num=100&as_q=volcanic&as_epq=climate+change&as_sitesearch=.edu
http://www.google.com/search?num=100&as_q=ozone&as_epq=climate+change&as_sitesearch=.edu
http://www.google.com/search?num=100&as_q=geomagnetic&as_epq=climate+change&as_sitesearch=.edu
http://www.google.com/search?num=100&as_q=solar&as_epq=climate+change&as_sitesearch=.edu
http://www.google.com/search?num=100&as_q=cosmic&as_epq=climate+change&as_sitesearch=.edu
http://www.google.com/search?num=100&as_q=methane&as_epq=climate+change&as_sitesearch=.edu
http://www.google.com/search?num=100&as_q=carbon-dioxide&as_epq=climate+change&as_sitesearch=.edu
http://www.google.com/search?num=100&as_q=ocean&as_epq=climate+change&as_sitesearch=.gov
http://www.google.com/search?num=100&as_q=volcanic&as_epq=climate+change&as_sitesearch=.gov
http://www.google.com/search?num=100&as_q=ozone&as_epq=climate+change&as_sitesearch=.gov
http://www.google.com/search?num=100&as_q=geomagnetic&as_epq=climate+change&as_sitesearch=.gov
http://www.google.com/search?num=100&as_q=solar&as_epq=climate+change&as_sitesearch=.gov
http://www.google.com/search?num=100&as_q=cosmic&as_epq=climate+change&as_sitesearch=.gov
http://www.google.com/search?num=100&as_q=methane&as_epq=climate+change&as_sitesearch=.gov
http://www.google.com/search?num=100&as_q=carbon-dioxide&as_epq=climate+change&as_sitesearch=.gov
http://www.google.com/search?num=100&as_q=ocean&as_epq=climate+change&as_sitesearch=.org
http://www.google.com/search?num=100&as_q=volcanic&as_epq=climate+change&as_sitesearch=.org
http://www.google.com/search?num=100&as_q=ozone&as_epq=climate+change&as_sitesearch=.org
http://www.google.com/search?num=100&as_q=geomagnetic&as_epq=climate+change&as_sitesearch=.org
http://www.google.com/search?num=100&as_q=solar&as_epq=climate+change&as_sitesearch=.org
http://www.google.com/search?num=100&as_q=cosmic&as_epq=climate+change&as_sitesearch=.org
http://www.google.com/search?num=100&as_q=methane&as_epq=climate+change&as_sitesearch=.org
http://www.google.com/search?num=100&as_q=carbon-dioxide&as_epq=climate+change&as_sitesearch=.org
http://www.google.com/search?num=100&as_q=ocean&as_epq=climate+change&as_sitesearch=.int
http://www.google.com/search?num=100&as_q=volcanic&as_epq=climate+change&as_sitesearch=.int
http://www.google.com/search?num=100&as_q=ozone&as_epq=climate+change&as_sitesearch=.int
http://www.google.com/search?num=100&as_q=geomagnetic&as_epq=climate+change&as_sitesearch=.int
http://www.google.com/search?num=100&as_q=solar&as_epq=climate+change&as_sitesearch=.int
http://www.google.com/search?num=100&as_q=cosmic&as_epq=climate+change&as_sitesearch=.int
http://www.google.com/search?num=100&as_q=methane&as_epq=climate+change&as_sitesearch=.int
http://www.google.com/search?num=100&as_q=carbon-dioxide&as_epq=climate+change&as_sitesearch=.int
http://www.google.com/search?num=100&as_q=ocean&as_epq=climate+change&as_sitesearch=.ca
http://www.google.com/search?num=100&as_q=volcanic&as_epq=climate+change&as_sitesearch=.ca
http://www.google.com/search?num=100&as_q=ozone&as_epq=climate+change&as_sitesearch=.ca
http://www.google.com/search?num=100&as_q=geomagnetic&as_epq=climate+change&as_sitesearch=.ca
http://www.google.com/search?num=100&as_q=solar&as_epq=climate+change&as_sitesearch=.ca
http://www.google.com/search?num=100&as_q=cosmic&as_epq=climate+change&as_sitesearch=.ca
http://www.google.com/search?num=100&as_q=methane&as_epq=climate+change&as_sitesearch=.ca
http://www.google.com/search?num=100&as_q=carbon-dioxide&as_epq=climate+change&as_sitesearch=.ca
http://www.purdue.edu/climate/links/index.htm
http://www.ispe.arizona.edu/research/links.html
http://www.ncdc.noaa.gov/oa/climate/research/monitoring.html
http://www.ncdc.noaa.gov/oa/climate/globalwarming.html
http://www.noaa.gov/greenhouse.html
http://www.ogp.noaa.gov/ Office of Global Programs
http://gcmd.nasa.gov/ NASA's Global Change Master Directory
http://gcmd.nasa.gov/Resources/pointers/weblights.html
http://gcmd.nasa.gov/Resources/pointers/glob_warm.html
http://www.cmdl.noaa.gov/ Climate Monitoring & Diagnostics Laboratory
http://cdiac.esd.ornl.gov/ Carbon Dioxide Information Analysis Center
http://globalchange.gov/ U.S. Global Change Data and Information System (GCDIS)
http://www.climatescience.gov/
http://www.esrl.noaa.gov/gmd/ Earth System Research Laboratory Global Monitoring
Division
http://www.usgcrp.gov/ US Global Change Research Program
http://www.epa.gov/cpd.html Climate Protection Partnerships
http://yosemite.epa.gov/oar/globalwarming.nsf/content/index.html
http://www.ndsc.ncep.noaa.gov/ Network for the Detection of Stratospheric Change
http://www.arm.gov/ Atmospheric Radiation Measurement Program
http://www.geo.nsf.gov/egch/ National Science Foundation Global Change Research
Programs
http://www.ngdc.noaa.gov/paleo/ NOAA Paleoclimatology Program
http://www.arctic.noaa.gov/
http://www.beringclimate.noaa.gov/
http://www-airs.jpl.nasa.gov/Products/
http://icesat.gsfc.nasa.gov/
http://aura.gsfc.nasa.gov/science/dataproducts.html
http://www1.whoi.edu/ U.S. Joint Global Ocean Flux Study
http://www.ciesin.columbia.edu/ Center for International Earth Science Information
Network
http://www.pfel.noaa.gov/research/climatemarine/ Pacific Fisheries Environmental Laboratory
http://www.climatechange.gc.ca/english/
http://www.ec.gc.ca/climate/home-e.html
http://www.iisd.ca/process/climate_atm.htm International Institute for Sustainable Development
http://www.gcrio.org/ Global Change Research Information Office
http://www.agci.org/ Aspen Global Change Institute
http://www.pewclimate.org/ The Pew Center on Global Climate Change
http://www.gefweb.org/ Global Environment Facility
http://www.climateark.org/ Climate Change Portal
http://unfccc.int/ United Nations Climate Change Secretariat
http://www.wmo.int/pages/prog/wcrp/wcrp-index.html World Climate Research Programme
http://www.ipcc.ch/ Intergovernmental Panel on Climate Change
CLIMATE COLLAPSE The Pentagon's Weather
Nightmare By David Stipp
http://www.fortune.com/fortune/print/0,15935,582584,00.html
http://www.gfdl.noaa.gov/aboutus/climate_dynamics/
http://www.al.noaa.gov/WWWHD/Pubdocs/research.html Aeronomy Laboratory
http://story.news.yahoo.com/fc?cid=34&tmpl=fc&in=World&cat=Climate_Change
http://www.nytimes.com/library/national/warming-index.html
http://www.google.com/search?num=100&q=global-warming+national-security
Other Weather Links
_
http://www.nws.noaa.gov/nwr/ NOAA Weather Radio
http://www.nws.noaa.gov/nwr/nwrbro.htm frequencies
http://www.cpc.ncep.noaa.gov/products/analysis_monitoring/lanina/ El Nino
http://www.cpc.ncep.noaa.gov/products/analysis_monitoring/enso_advisory/
http://www.jpl.nasa.gov/elnino/ El Nino
http://nsipp.gsfc.nasa.gov/enso/index.html El Nino
http://www.oar.noaa.gov/search/sitemap.html Office of Oceanic and Atmospheric Research (OAR
http://www.usda.gov/agency/oce/waob/jawf/ Joint Agricultural Weather Facility
http://www.legislative.noaa.gov/
http://www.sab.noaa.gov/Reports/Reports.html NOAA's Science Advisory Board (SAB)
http://coastalmanagement.noaa.gov/ Office of Ocean and Coastal Resource Management (OCRM)
http://www.ngdc.noaa.gov/seg/geomag/ Geomagnetism
http://sos.noaa.gov/datasets/ Science On a Sphere Dataset Catalog
http://sos.noaa.gov/datasets/Land/nightlights.html Nighttime Lights
of the World
ftp://public.sos.noaa.gov/land/earth_night/ Nighttime Lights
of the World
http://www.ngdc.noaa.gov/dmsp/download.html Nighttime Lights
of the World
http://www.ngdc.noaa.gov/dmsp/image/ Nighttime Lights
of the World
http://photojournal.jpl.nasa.gov/catalog/PIA02991 Nighttime Lights
of the World
http://www.nasa.gov/lb/vision/earth/everydaylife/Growing_Cities_AGU.html Nighttime Lights
of the World
http://sabr.ngdc.noaa.gov/ntl/ Nighttime Lights
of the World
http://earthobservatory.nasa.gov/Study/Lights/ Nighttime Lights
of the World
http://www.pmel.noaa.gov/vrl/LightView/LightView.html Nighttime Lights
of the World
http://svs.gsfc.nasa.gov/search/Series/EarthatNight.html Nighttime Lights
of the World
http://nationalatlas.gov/mld/nitelti.html Nighttime Lights
of the World
http://www.au.af.mil/au/2025/volume3/chap15/v3c15-1.htm#Contents Control of
Weather and Ionosphere to harm enemies
http://users.ev1.net/~seektress/club2.htm ? Chemtrails ?
_
news:sci.geo.meteorology
news:alt.talk.weather
http://www.joss.ucar.edu/gapp/ good weather
links
http://vortex.plymouth.edu/make.html
http://cirrus.sprl.umich.edu/wxnet/servers.html
http://www.unidata.ucar.edu/community/community.servers.html
http://weather.noaa.gov/pub/SL.us008001/DF.c5/ Lots of raw data
http://weather.noaa.gov/pub/SL.us008001/CU.srrs/PT.text/
http://thunder.storm.uni.edu/data/nwx/ Lots of raw data
http://dao.gsfc.nasa.gov/DAO_people/towens/VLM/
http://www.nrlmry.navy.mil/~chu/tclinks.htm
http://www.hcane.com/
http://www.hurricanealley.net/natl.htm
http://www.atwc.org/
http://www.hwn.org/ Amateur Radio Hurricane Watch Net
http://www.stormtrack.org/
http://www.weatherwatchers.org/
http://www.weathermatrix.net/
http://www.people.fas.harvard.edu/~dbaron/links/WTropical
http://weather.hypermart.net/software.html Weather software
http://www.met.fsu.edu/explores/tropical.html
http://www.weathervine.com/ Live storm
chasers
http://www.weathergraphics.com/
http://www.storm-track.com/
http://www.tornadoproject.com/
http://www.flhurricane.com/links.htm
http://www.dca.state.fl.us/bpr/EMTOOLS/wx.htm
http://www.nlmoc.navy.mil/
http://www.ominous-valve.com/hurrlist.txt Hurricane related Radio Frequencies
http://stormcarib.com/index.htm#reports Weather
Discussions and Local Reports from the Carib.
http://web.usna.navy.mil/~bruninga/wx.html javascript/java
Amateur Radio weather/position
reporting stations
http://webpages.charter.net/rdelp/wxradar.html
http://home.inreach.com/skytrack/
http://fermi.jhuapl.edu/hurr/
http://www.ugems.psu.edu/~owens/
http://www.atmos.uiuc.edu/wxinfo.html
http://www.webring.org/cgi-bin/webring?ring=weather;list
_
http://image.weather.com/images/maps/winter/skieastq_720x486.jpg
http://image.weather.com/images/maps/winter/skiwestq_720x486.jpg
http://image.weather.com/images/maps/winter/skieast_720x486.jpg
http://image.weather.com/images/maps/winter/skiwest_720x486.jpg
http://image.weather.com/images/maps/winter/skieast3_720x486.jpg
http://image.weather.com/images/maps/winter/skiwest3_720x486.jpg
http://image.weather.com/images/maps/winter/us_ski_comfort_index_day1_720_nl.jpg
http://image.weather.com/images/maps/winter/us_ski_comfort_index_day2_720_nl.jpg
http://image.weather.com/images/maps/winter/us_ski_comfort_index_day3_720_nl.jpg
http://image.weather.com/images/maps/winter/us_ski_comfort_index_day4_720_nl.jpg
http://image.weather.com/images/maps/winter/us_ski_comfort_index_day5_720_nl.jpg
http://image.weather.com/images/maps/winter/us_ski_comfort_index_day6_720_nl.jpg
http://image.weather.com/images/maps/winter/us_ski_comfort_index_day7_720_nl.jpg
http://image.weather.com/images/maps/winter/us_ski_comfort_index_day8_720_nl.jpg
http://image.weather.com/images/maps/winter/us_ski_comfort_index_day9_720_nl.jpg
http://image.weather.com/images/maps/winter/us_ski_comfort_index_day10_720_nl.jpg
http://image.weather.com/images/maps/special/foliage_nc_cur_720x486.jpg
http://image.weather.com/images/maps/special/foliage_ne_cur_720x486.jpg
http://image.weather.com/images/maps/special/foliage_nw_cur_720x486.jpg
http://image.weather.com/images/maps/special/foliage_se_cur_720x486.jpg
http://image.weather.com/images/maps/special/foliage_sw_cur_720x486.jpg
http://image.weather.com/images/maps/special/fall_peak_nc_720x486.jpg
http://image.weather.com/images/maps/special/fall_peak_ne_720x486.jpg
http://image.weather.com/images/maps/special/fall_peak_nw_720x486.jpg
http://image.weather.com/images/maps/special/fall_peak_se_720x486.jpg
http://image.weather.com/images/maps/special/fall_peak_sw_720x486.jpg
http://image.weather.com/web/maps/recreation/golf/forecast/us_national_golf_index_day1_720_en.jpg
http://image.weather.com/web/maps/recreation/golf/forecast/us_national_golf_index_day2_720_en.jpg
http://image.weather.com/web/maps/recreation/golf/forecast/us_se_golf_index_day1_720_en.jpg
http://image.weather.com/web/maps/recreation/golf/forecast/us_se_golf_index_day2_720_en.jpg cn ec nc ne nw sc se sw wc
Nautral
Hazard Statistics and Publications
_
Rank estimates of
weather-related human fatalties in the USA for the past three
decades. This does not include geology-related deaths from
earthquakes, tsunamis, or volcanoes. In addition, the statistics
do not include fatalties due to low visibilties caused by fog,
smoke, dust, sand, and/or precipitation. Low visibility may rank
high in the list of hazards.
1. Heat Waves
2. Winter Storms and Cold Extremes
3. Floods
4. Wind Storms
5. Lightning
6. Tornadoes
7. Tropical Cyclones
8. Hail
9. BrushFires and Drought
http://www.weather.gov/safety.html
http://www.nws.noaa.gov/om/hazstats.shtml - http://www.nws.noaa.gov/om/brochures.shtml
http://www.nws.noaa.gov/education.html
http://www.fema.gov/hazards/
http://www.naturalhazards.org/
http://www.usatoday.com/weather/wsafe0.htm
http://www.ncdc.noaa.gov/oa/reports/weather-events.html
http://mceer.buffalo.edu/infoService/bibs/disman.asp
http://ndrd.gsfc.nasa.gov/
http://disasterfinder.gsfc.nasa.gov/
http://www.nws.noaa.gov/om/severeweather/
http://www.noaa.gov/floods.html
http://hurricanes.noaa.gov/
http://www.nws.noaa.gov/om/hurricane/
http://www.aoml.noaa.gov/hrd/
http://www.education.noaa.gov/
Deaths due to
weather/weather related phenomena in FLORIDA: 1959-1993
(from Storm Data)
Lightning 53.1%
Drowning 16.1%
Tornadoes 12.9%
Hurricanes 8.7%
Wind 4.2%
Cold 3.5%
Misc 1.5%
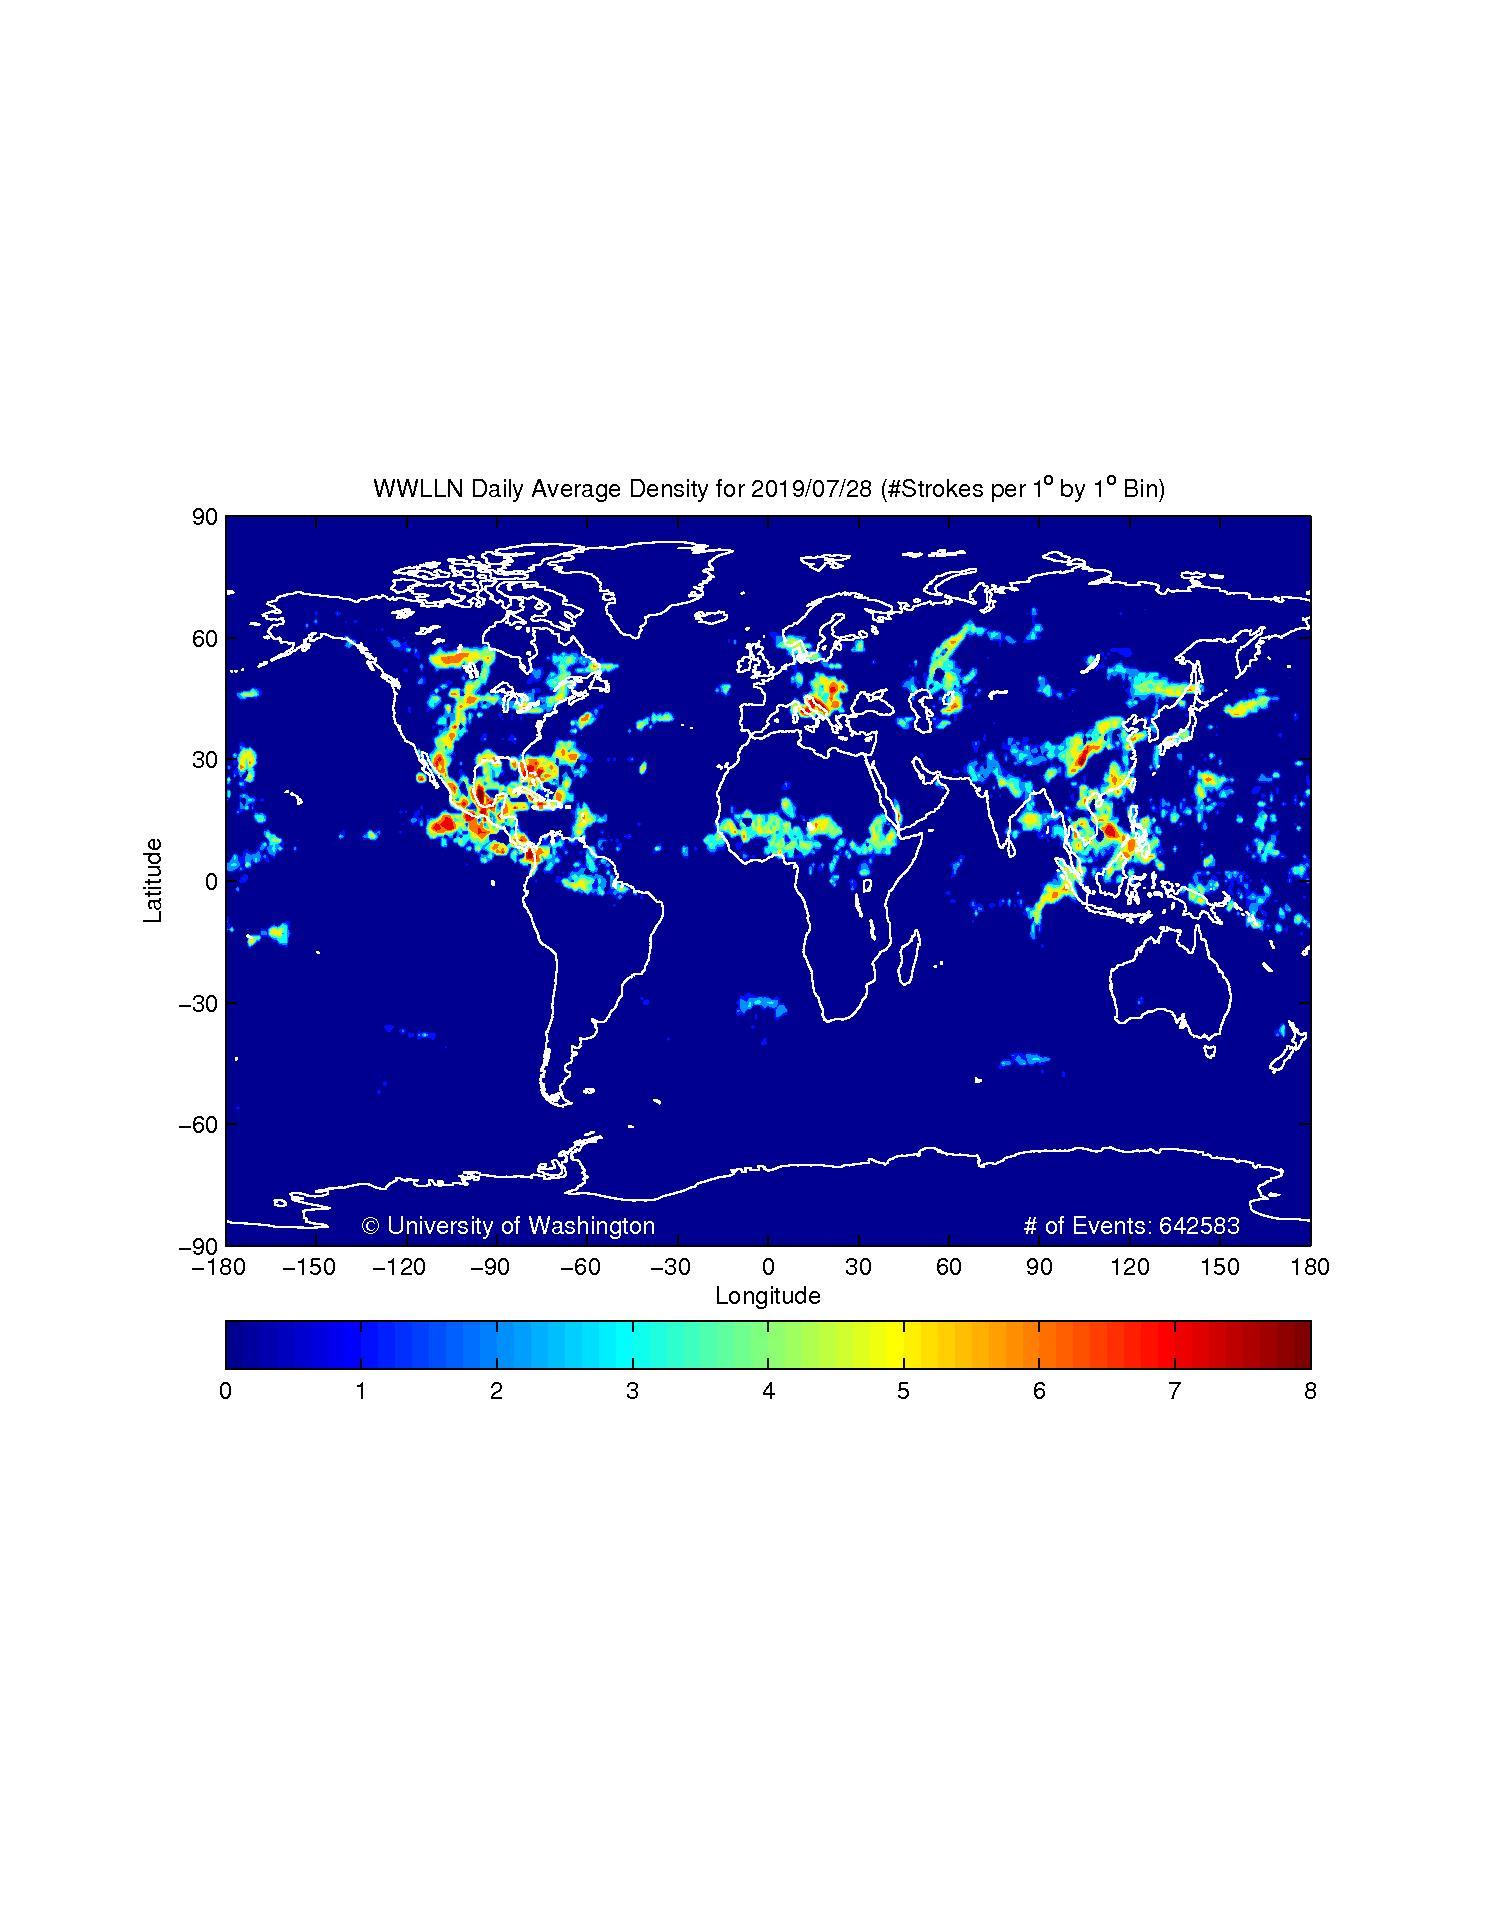
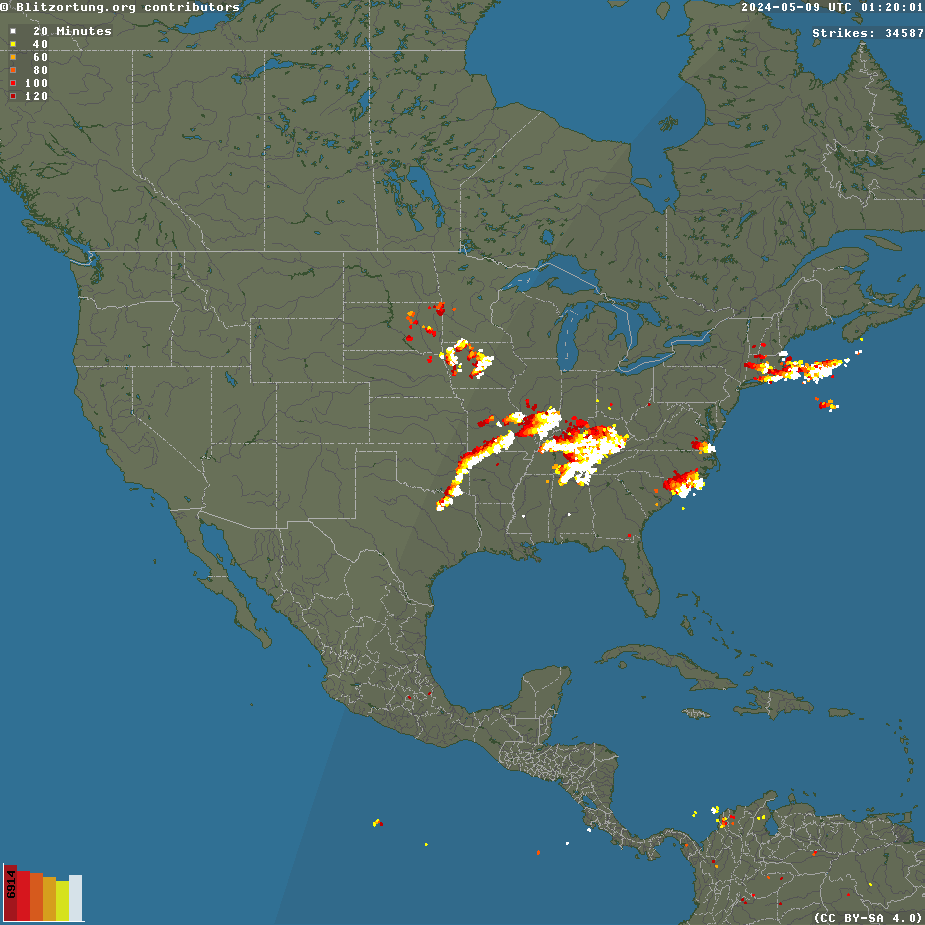