About VectorFox
VectorFox was born out of a desire to use PC technology to gain a competitive edge over
fellow Melbourne fox hunters. VectorFox has its roots in a previous project,
RotorHunter, with the same PC interface and some
common software routines. However, unlike RotorHunter, VectorFox requires either
manual rotation of the antenna
or Agrelo data from another source. It includes a GPS interface for mapping of
position and direction information. VectorFox runs under Windows 95 or 98.
The parallel interface is the same one used for RotorHunter and can be viewed
here. VectorFox can use any input having a voltage output
between 0 and 5 volts, which varies depending on the position of the manually rotated
antenna. The parallel interface is not required if Agrelo data is used.
|
Click for full size image
|
Currently I use inputs from a 2m and 70cm receiver signal meters and a 2m noise meter as well as
an indication of the beam direction.
The meter inputs are plotted on the screen, as a polar plot, and a line is
automatically drawn through the signal peak. If the operator wishes to use this
bearing he either clicks on the plot or press a button on the interface box and this bearing is drawn on the map.
For information on using the signal meter outputs of the Kenwood TM742
click here.
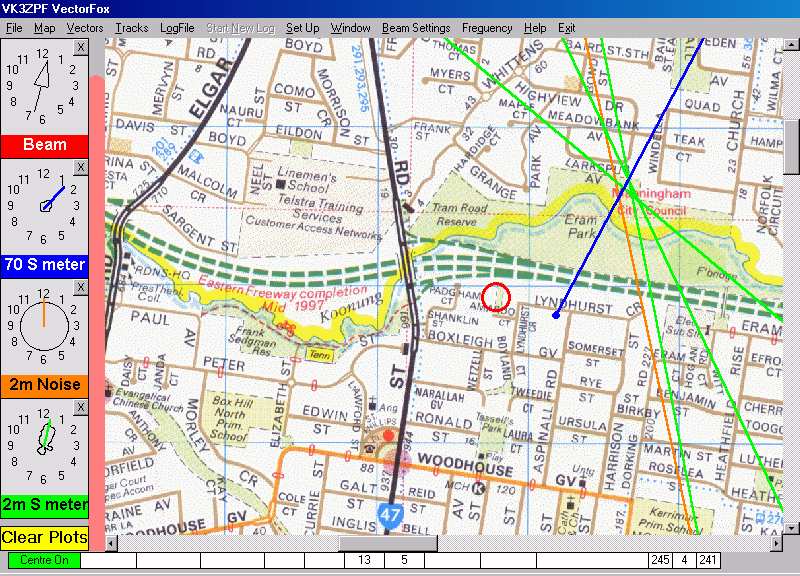
Screen Features
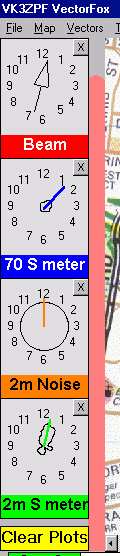 |
Along the left edge of the screen are 4 small boxes used to display the results.
Beam
This box shows the current position of the beam antennas relative to the vehicle.
70cm S meter
This box shows the output voltage of the 70cm receiver signal meter. Again the 70cm receiver
is tuned to 3 times the 2m frequency. This signal meter voltage also increases as the signal
being received increases. Because this receiver is also connected to a Yagi type antenna the
resulting plot is a polar plot of the antenna and a purple line is automatically drawn through
the peak of the signal.
2m Noise
This box, in this instance, is for display of the voltage derived from a noise meter circuit
connected to a 2m FM receiver. The noise meter gives an increasing voltage as the received
noise decreases until the FM receiver reaches full quieting, at which stage the output voltage
is at 5 volts. The example shown here has reached full quieting. By using a noise meter a weak
signal can be detected long before the signal meter starts to move.
2m S meter
This box shows the output voltage of the 2m receiver signal meter. This signal meter voltage
increases as the signal being received increases. Because the receiver is connected to a Yagi
type antenna the resulting plot is a polar plot of the antenna and a green line is
automatically drawn through the peak of the signal. If the operator selects this plot as
being the direction of the transmitter a green vector is drawn on the map from the position
where the peak was captured in the direction of the peak at that time.
Alongside each of these boxes is a single bar indication. This is driven by a receiver conected to an omnidirectional antenna and simply indicates the unattenuated incoming signal level. This is useful as it shows the relative closeness to the transmitter.
|
Clear Plots
The Clear Plots button will clear all the plots currently displayed in the 3 lower boxes. The beam display is constantly updated and does not require clearing.
Each of the lower 3 boxes can be assigned to an input from any source. The only requirement
is a varying voltage between 0 and 5 volts, relative to the position of the antenna or the
front of the vehicle. The colour drawn on the map and the text describing each box can be
changed within VectorFox's configuration.
Adjustments can also be made for voltages which do not have a full 5 volt swing. For example
the signal meter output of a Kenwood TM742 varies from 0.9 V to 5 volts and VectorFox can be
configured to ignore all values below 0.9 volts.
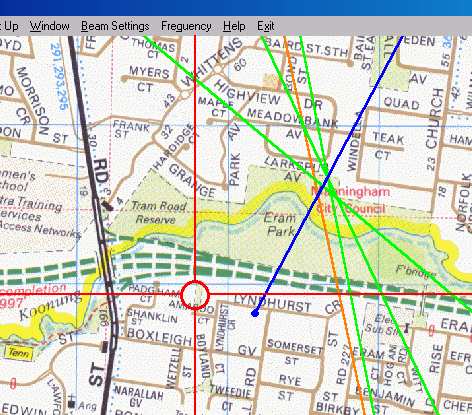
This screen snap shows the results of a recent Melbourne fox hunt. The actual transmitting
location was within 50m of where the green and blue vectors cross.
The green vectors were drawn by the operator clicking on the 2m S meter plot whilst
the blue vector was drawn from the 70cm S meter plot.
The red cross hairs (optional) intersect with a small red circle. This circle shows where
the vehicle is at the present time.
A track taken indication is available which plots on the map the path taken by the
vehicle as it travels along. I like to leave this option off as it tends to clutter up
the screen. The width of the vectors can be adjusted from 1 pixel up to 20 pixels wide.
The vectors in this shot are 2 pixels wide.
|
|
|
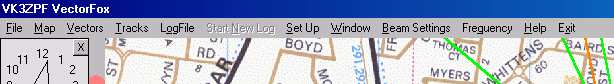
The menu bar of VectorFox allows access to all of the features.
|
|
From left to right they are:
File: This menu item contains only the Exit command.
Map: This item allows users to access map files and choose which map is displayed.
Vectors: This item allows the user to delete the last vector drawn, protect the last
vector drawn and clear all drawn vectors. By protecting a vector it is not removed by the
clear all vectors function. This allows for trusted vectors taken from the tops of hills to
remain when suspect vectors are cleared. The width of vectors is also set within this menu
item.
Tracks: This item allows the track function to be turned on and off. Tracks are then
drawn, following the route taken by the vehicle. These tracks are secondary to the vector
function and will be removed if another map is loaded or the clear vector function is used.
Log File: This allows live data to be written to a log file for later replay. The log
file includes all vehicle positions and all vectors drawn. This item also allows for the
replaying of log files recorded earlier.
Start New Log: This allows the user to start a new log file with a single click.
Set Up: This allows access to all the configuartion settings including serial and
parallel ports.
Window: This allows the user to turn off each of the four plot boxes.
Beam Settings: This allows for calibrating the beam position to the front of the
vehicle.
Frequency: This function allows VectorFox to control the frequencies of the Kenwood
TM742 radio. Both 2m and 70cm freqencies can be set at the same time.
Help: This function allows access to the VectorFox help file.
Exit: This item allows the user to exit VectorFox.


Copyright 2001 - Peter Fraser - all
rights reserved.