
80 meter Winter DX Analysis From VE6
This is an analysis of 80m DX QSO data at VE6WZ from 7 the years 2002 to 2008.
PURPOSE:
The purpose is to evaluate:
Operating habits, variability and analysis error:
This is a winter season ONLY dataset.
The following yearly analysis is obviously going to be influenced by annual variability in operating habits and activity at VE6WZ. Although an “operating day analysis” could be extracted from the dataset, this has not been done yet, and would in itself be skewed by band conditions ie. No activity, because no band openings. Winter DX activity has been fairly consistent at 5-6 nights a week depending on conditions. The packet will also be watched, and drive activity based on conditions. Hourly activity has also been consistent and mostly determined by band conditions. If the band is open, operating will usually run late into the morning hours. Early morning or sunrise grey-line activity is less consistent, and tends to be more driven by packet spots, rather than radio time. The evening or sunset grey-line opening is a deficiency in the VE6WZ dataset. This evening/afternoon operating window is not convenient (dinner-time), but DOES represent a significant DX opening on 80m and is not well represented in this dataset.
THE DATABASE
For each winter season (7 months March-September) from 2002-2008 data for 80m QSO’s has been extracted from the VE6WZ log.
The database contains:
5,861 Total QSO’s,
2,854 DX QSO’s,
232 DXCC entities
37 zones.
DXCC list of entities worked and some soundfile links : Click here (opens new window)
|
|
||||||||||||||||||||||||||||||||||||||||||||||||||||||||||||||||||||||||||||||||||||||||||||||||||||||||||||||||||||||||||||||||||||||||||||||||
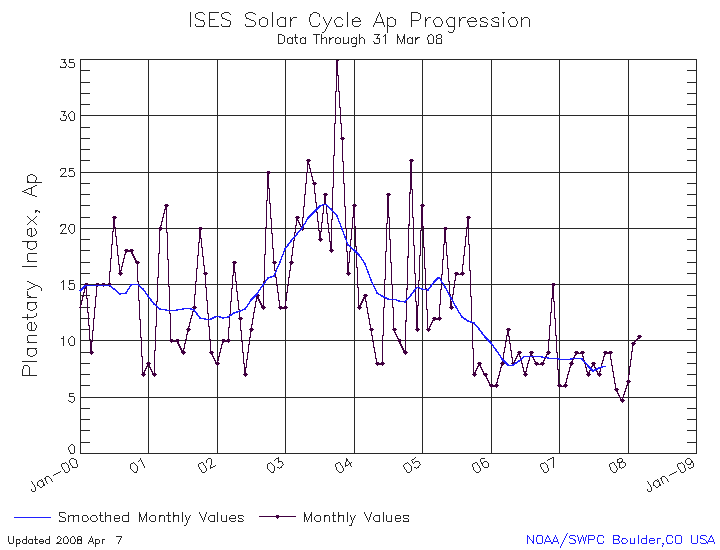
DX QSO COUNT AS A FUNCTION OF GEOMAGNETIC ACTIVITY
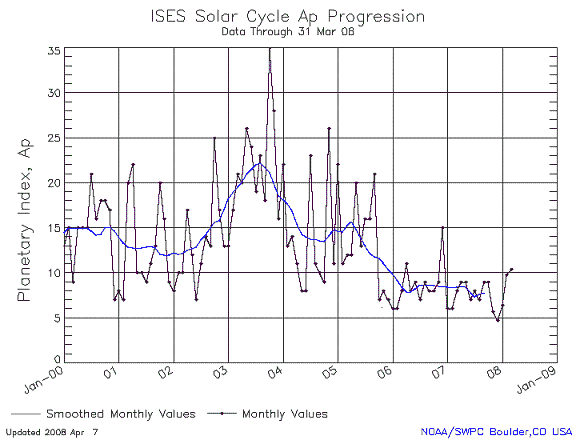
Working DX on 80m can be hindered by increased geomagnetic activity, especially at northern latitudes like VE6. Signal absorption by the increased Aurora activity can negatively impact polar paths. The expectation would be that DX QSO’s on 80m should be best during the years 2006-2007 when the Ap was at it’s lowest.
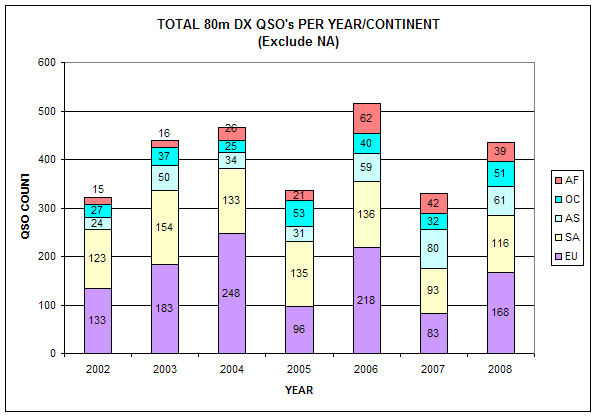
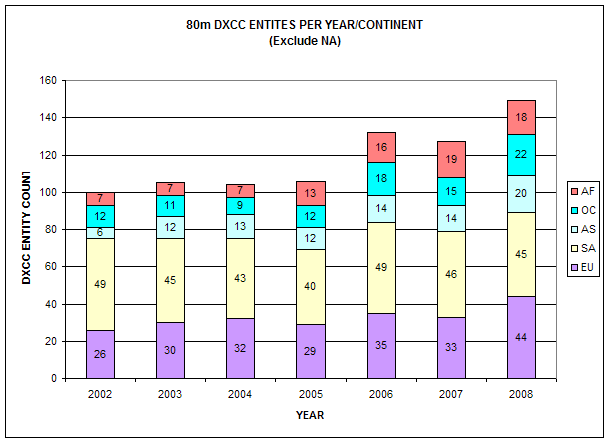
Below is chart from NOAA showing the monthly planetary A index (Ap) over the past 8 years, together with a charts showing the VE6WZ DX QSO’s, and DXCC entities worked for each continent per year:
|
|
|
|
|
|
The above data seems to support increased DXCC entities worked during the lower Ap years 2006-8. The two BEST years for DXCC entities worked are 2006 and 2008. These two years also had the most days when the band opened to EU (57 and 53 respectively). The Ap activity chart shows these years have the lowest monthly value dips. 2007 was a poor year and a corresponding Ap spike shows in the month of December. 2005 was also a very poor year and also shows increased winter Geomag activity. Years 2002 and 2003 seem to contradict the relative DX QSO count since these years had VERY high geomag activity, but greater QSO count than 2008. The years 2002 and 2003 had better LONG-PATH openings into EU compared to later years which helped boost the EU totals. These years also show increased days for EU openings because of these LP QSO’s. It seems that LP EU openings are enhanced during higher Ap years, while the SP (polar routes) are hindered. This is described later in the LP SP Europe analysis.
In summary, there appears to be a good correlation with increased DX potential on 80m with lower Geomagnetic activity. The lower Ap years seem to provide better world wide openings (more DXCC entities worked). Higher Ap years hinder worldwide DX openings, but still allow for DX communication even during the “worst” years. DXCC has been worked on 80m every year since 2002.
80m DX band peak opening times (UTC) for each continent
Charts where made plotting QSO count vs UTC time for each continent: Please click here (opens new window)
EUROPE: A strong peak for EU QSO’s is centered around 0700 UTC (12-1 am local). This is coincident with EU sun-rise and the corresponding propagation peak, but is also a function of EU operators getting up from sleeping. Prior hours (except during contests) most operators are still in bed! Certainly to work EU reliably on 80m, an operator needs to be prepared to stay up late!! Overall, for the last 7 years, 71% of all SP EU QSO's have been AFTER 0500z.
A second, and important LP (long-path) peak is seen around 1400-1500z. This is just around VE6 sunrise and continues for up to two hours after sunrise. This is coincident with EU sunset. Signals usually arrive at about 240 deg azimuth (SW), but can sometime skew towards the NW. About 11% of all EU QSO's have been via this path, although during the higher sunspot years up to 23% of EU QSO's have been LP. A detailed analysis of the LP-SP variations is presented later.
As mentioned earlier, the VE6WZ dataset lacks "radio-time" during the sun-set EU opening (around 2200-0100 UTC). This late afternoon, pre-sunset propagation enhancement can be significant on 80m and is not adequately represented here.
SA: A broad peak around 0500 UTC, with QSO’s extending through all hours of darkness. A noticeable N-S propagation peak has been observed at VE6WZ around mid-night local time.
OC: Two peaks are apparent on this data-set: one around 0700, which represents KH6 and another south pacific islands, and the second around 1500 UTC representing VK, ZL, and other more western Pacific islands. Also.....VE6WZ needs to sleep sometime, and 0800-1000 hrs UTC is a very low QRV time !!
AS: Asia shows a pronounced QSO peak centered around 1500 UTC probably an expression of JA and UA9 QSO's during the VE6 sunrise. QSO's show up for all hours from 0200 till sunrise because this dataset includes so many zones spread across the earth; zones-17,18,19,20,21,22,23,24,25,26,27. Like all 80m QSO’s, common darkness is the main requirement for propagation and SR-SS times vary greatly across these zones.
AF: Africa shows a pronounced QSO peak around 0500 UTC likely the result of earlier SR over much of southern Africa compared to EU. West Africa (EA8,CN,CT3,6W,EA9 etc.) experiences a later SR than EU, but because West Africa is so much easier to work than much of EU, these QSO's are often made prior to any pre-dawn enhancement effects.
80m EUROPE DX peak band opening times UTC for each year
For each year from 2002-2008, the number of QSO’s with EU was extracted and plotted against UTC to see if there were variations due to geomagnetic activity. Except for a peak in LP (long path) openings during the years 2003-2004, the same 0700 night time peak was the same for each of the last 7 years.
Please click here (opens new window)
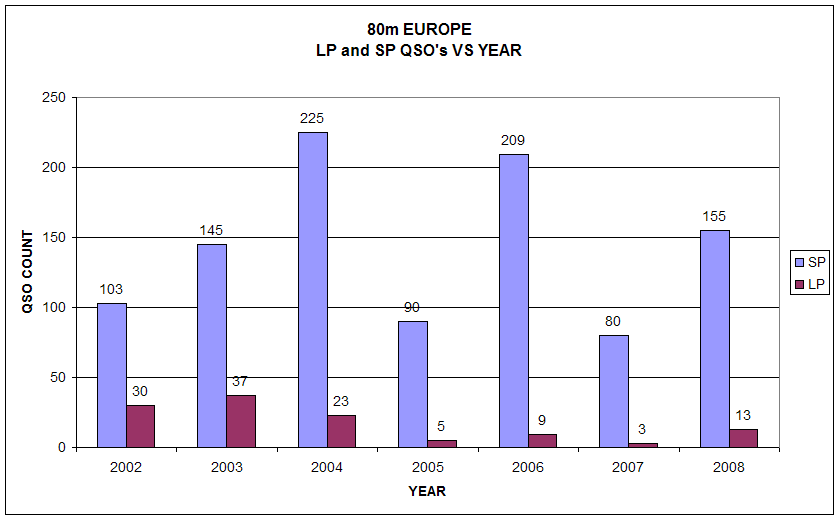
80m LP and SP Band opening to Europe as a function of geomagnetic activity
The chart below shows the variation of Europe LP and SP QSO’s vs Year along with the NOAA Ap historical geomagnetic activity chart.
There appears to be an obvious enhancement of LP conditions during the peak Ap years 2003-2004. During these years, 20%-23% of all EU QSO's where LP, vs less than 10% for other years. It seems like LP QSO’s require more solar and geomagnetic activity to provide reliable openings. Here is are some plots for the last 9 yrs showing DX entities worked vs UTC time togethere with VE6 Sunrise: 80mSR_PLOTS
|
80m QSO's with Europe SP- Short Path-the NE direct polar path LP- Long Path-the SW morning path
|
 |
||||||||||||||||||||||||||||||||||||||||
 |
|||||||||||||||||||||||||||||||||||||||||