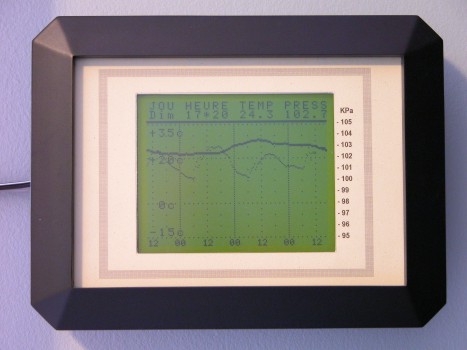
The narrow trace is the outside temperature graph.
The wide trace is the pressure graph.
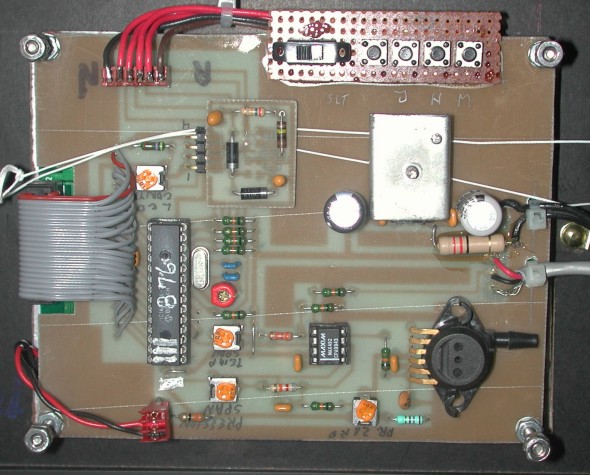
Front view Rear view
The narrow trace is the outside temperature graph.
The wide trace is the pressure graph.
2- A sudden decrease, even if it is small, announces a nearby
disturbance; normally meaning
wind, short showers. If large in 5 to 6 hours,
signals a comming storm.
3- A large, slow and maintained decrease announces a long
period of bad weather.
This bad weather will be more pronounced if
the barometer started higher to go lower.
4- A sudden rise of the pressure, when the pressure is about
average or above
average and the weather is nice, always
announces the aproach of a low and the barometer
will soon start to come down.
5- A rapid rise when the pressure is low, annonces a short
period of nice weather;
but, if the rise is large and prolonged, we
can count on a many days of good
weather.
| Here is the complete schematic
for the barograph. Here is the viewer/printer software for the PCBs, and the complete PCB file. The above vieweris self contained software and do not leave traces on your PC. Here is the source program and the object code The PCB and a pre-programmed PIC are availlable by writing to me at [email protected]. |