|
8.9kHz 'Dreamers' Grabber - Experiences - RX Log - QTH - SID detector |
|
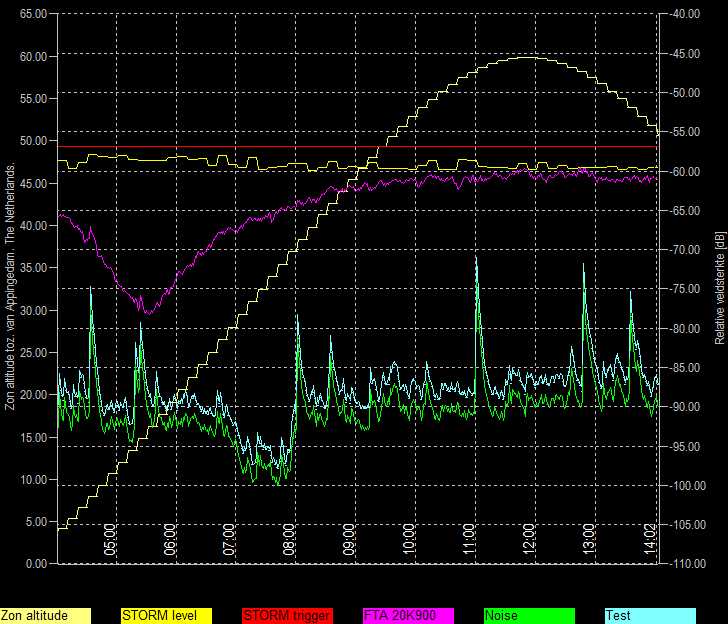
- SUDDEN IONOSPHERE DISTURBANCE (SID) MONITOR -
|
|
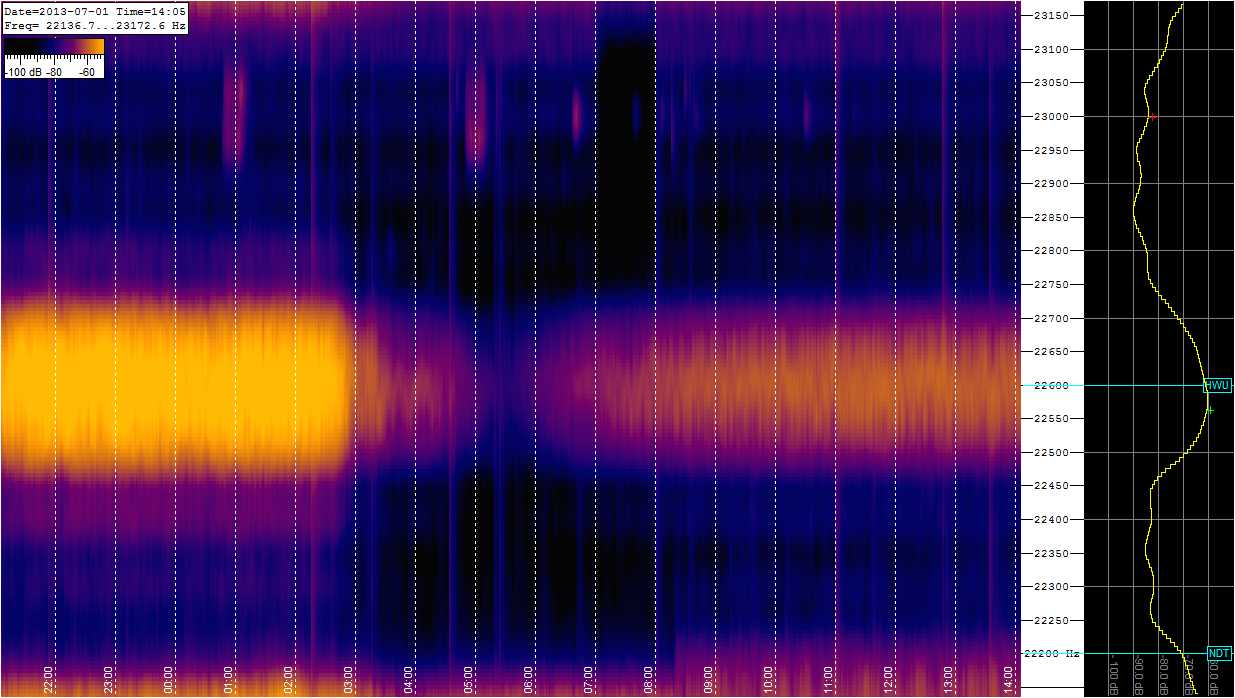
The observed VLF station catched in a audio
spectogram. |
|
8.9kHz 'Dreamers' Grabber - Experiences - RX Log - QTH - SID detector |
|
- SUDDEN IONOSPHERE DISTURBANCE (SID) MONITOR -
|
|
The observed VLF station catched in a audio
spectogram. |