|
|
||

Go to the http://www.unioncountyohioraces.org site. Email N8LHG |
This is a quick tour
of some of the Uranium graphics.
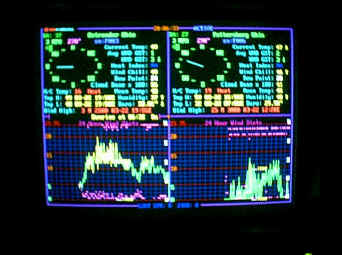
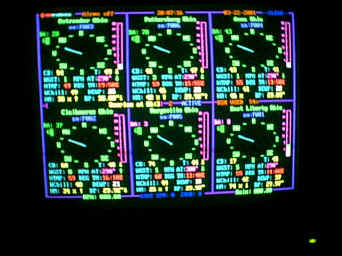
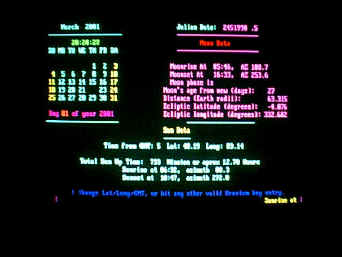
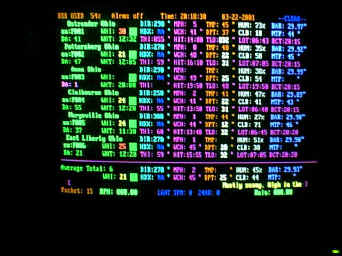
Uranium was originally designed for use by the Union County RACES and EMA some years back. The idea was to be able to view a DYNAMIC and REAL-TIME view of weather stations around and/or near Union County via amateur radio. Its intent was to be a SkyWARN tool, allowing Union County to track, and log detail weather data for use during and after weather alerts. APRS, while it has a strong presents in today's SkyWARN activity, is unable to fill this requirement. Uranium monitors, and tracks weather activity down to the second. The displays are dynamic, moving every second, mimicking the actual weather station activity as if you were standing at the station watching the actual station displays. This is all done via packet transmissions. The data is saved, and can be re-run at a later date to examine passed weather activity, and allow detailed and scientific investigations of any weather change. You can chart passed days, even display tables which can be imported into your favorite spread sheet. Uranium WIND displays show you wind gust, average, depending on what you choose, as well as a tracking of the direction at the time of the sample. The graphic to the left shows you a display of the wind (green and yellow), as well as a plotting of the wind direction along side (purple). The 6 station display, shows you in any order, 6 dynamic displays, allowing you to view any stat belonging to that station. The displays include current temp, barometric pressure, wind chill, peak gust with time, high temp with time, low temp with time, current humidity, dew point, and any trend associated with any of the data. A graphic flow chart, or speedometer, displays the wind speed in a graphic growing and shrinking display in real time. A second timer showing you how old the data is also displays. Detail about the month, moon orbit, and sun orbit can also be displayed. The graphic on the left shows you a current calendar, what day of the year it is, the moon rise and set, as well as its phase, and azimuth location of its rise and set. Sun rise and set, as well as amount of daylight, location of the sun rise and set, is also shown. Much of this data is dependant on the observers location. You can plug in your current latitude, and longitude for an accurate display of this data. If you are unsure of what this data actually is at your location, you can choose from a number of cities which have a known lat/long. Live data is constantly tracked and logged for every Uranium Host. This data, regardless of what display you are on, is logged and saved so nothing is lost or missed. The graphic on the left here shows three chartings which are associated with the top left wind rose. Each corner can be programmed to display wanted charts. Here we have temp, humidity, and wind speed. All charts which are displaying real-time data, show data beginning at midnight to current time. Uranium also tracks lightning strikes. This data is shown in real time, and is tracked in strikes per minute, as well as total strikes since midnight. You can chart in real-time, a current thunderstorm which may be blowing through. Uranium can also display a graphic of the counties, and a rose location of the monitored weather stations. These displays, just as any other Uranium display, is real-time, and totally dynamic. The upper right corner, gives an average display of all stations shown on the current screen. With the graphic on the left here, you see 6 stations, 4 which are located in or around Union County, 1 which is in Shelby County, and 1 which is actually located between the two counties, in this case, East Liberty Ohio. The numbers toggle between current temp, barometric pressure, wind speed, and wind direction. Another screen can show the real time data from these sites, in a digital or numeral display. This allows you to set alarm conditions to warn you of almost any change, trend, activity, or threshold. The screen here on the left shows 6 stations with all their tracked data represented in text format. Warning or thresholds are shows either by flashing numbers, change of color, or audio warnings. The 7th slot gives you average data of the 6 stations. At the bottom of these screens is a scrolling marquee. This marquee gives you the current, 5 day NWS forecast and any warning conditions. The "--CLEAR--" located at the top right of the screen will display WARNING, WATCH, STATEMENT, etc, depending on current conditions and NWS issuances. Obviously, Uranium is very time intensive. A master host sends out an hourly "tick" which is grabbed from a WWVH clock, and transmitted via packet, resetting all the Uranium Remote pc clocks and dates to be atomic clock accurate. The graphic on the left shows another Uranium display, showing you the atomic clock time, as well as one of the weather hosts humidity, temp, and barometric pressure. The scrolling marquee is also displayed at the bottom of this screen. I will place more about Uranium, and continue to expand this site as time will allow. Uranium Remote is available FREE to legally licensed hams, and can be downloaded free of charge at the Union County Races web site. Uranium is an original composition, copyright owned by Mark Wardell (N8LHG)
|
|