Animation
The image to the right is an animated .gif.
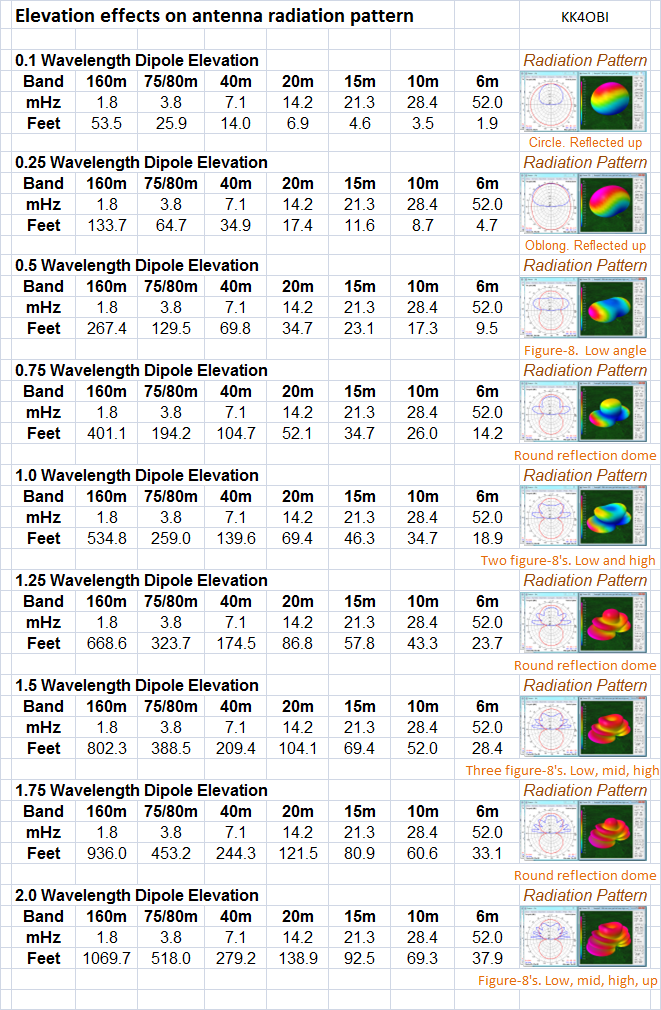
The 3D pictures and polar graphs illustrate the changes in far field radiation pattern due to antenna elevation over real ground.
- The range shown is from 0.1 to 2.0 wavelengths high.
- 0.1, 0.2, 0.3, 0.4, 0.5 WL are by slow steps then;
- by fast steps between each 0.5 WL thereafter.