To customize the colors of the waterfall (a special spectrum display), you
can change the colors associated with a particular signal strength (amplitude
or level). This chapter covers...
See also : Spectrum Lab's main index ,
Display Settings.
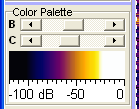
The Color Palette panel in the main window shows all colors that are
currently used for the waterfall display (a kind of "color legend").
Contrast and brightness of the waterfall can be controlled as described in another chapter.
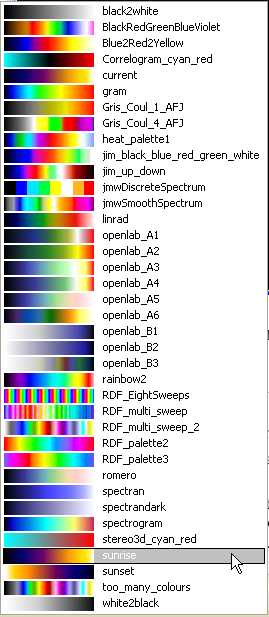
There are different colour palettes contained in Spectrum Lab (shown on the left; actually a screenshot
from the 'palette selector' menu which can be opened through the 'file' menu or by clicking into the colour legend).
Depending on the application you may use one of them, or define your own as explained later in this manual.
The color on the left side of the legend will be used to paint the lowest
possible amplitude in the waterfall (0dB, usually BLACK); the color on the
right side of the legend will be used to paint the highest possible amplitude
in the waterfall (100dB or 100% or whatever).
The default color legend which you see after the first start of the program
should look like a rainbow with smooth transitions from black to gray, blue,
green, yellow, orange, red and purple.
You can quickly select a different palette by clicking into the color legend.
Additionally, you may create your own color palette with the "Color Palette
Editor" (described further down in this document). The names shown in the colour palette menu
(see screenshot on the left) are actually the names of all files in the 'palettes' folder.
The two scrollers labeled "B" (brightness) and "C" (contrast) may be used
to shift and expand the color palette. Just try it, you will see the effect
of these controls immediately in the color legend. The waterfall will also
be re-painted immediately (COMPLETELY, not only the "new" recorded lines).
The scale under the color scale shows the visible range, usually in dB. Clicking
on this scale switches to the configuration dialog where the visible range
can be changed. Since V1.65, a theoretical dynamic range of 150dB is possible;
but you may only be interested in a small part of that range.
The relationship between input voltage into the A/D-converter and the FFT
output values (usually converted to dB) is explained
here.
back to top
If you are not satisfied with the waterfall color palettes supplied with
Spectrum Lab (loadable via File menu), you can create your own (and donate
them to other users ;-).
The "Options"-menu of the spectrum+waterfall window lets you open the "Color
Palette Editor" where you may modify all colors used for the waterfall display.
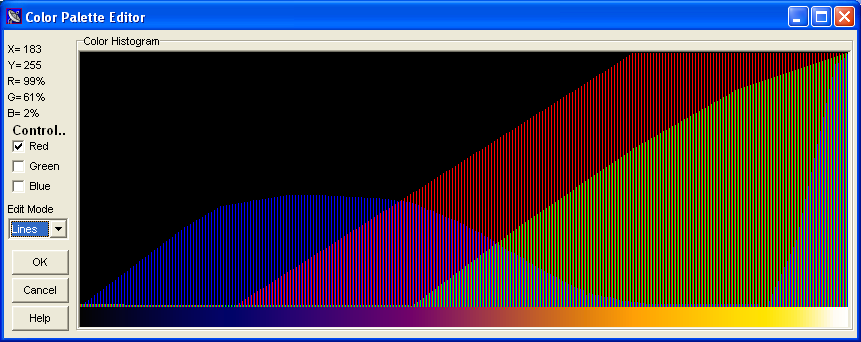
All 255 colors that may be used for the waterfall are "mixed" in a large
color histogram (a kind of bargraph with 255 thin bars, each bar represents
one color).
Each of the 255 colors is a mix of three components (red, green, blue).
When you move the mouse across a color bar, you can see the RGB-"mixture"
of the color on the left side of the window.
The height of a bar is equal to the amount of the RED, GREENand BLUE component.
If the R,G and B components of a bar have the same height, the resulting
color is a shade of gray;
if the R component is higher than G and B, the resulting color will be a
more or less saturated shade of red, and so on.
The resulting mixed colors can be seen below the color bars (they will be
updated immediately as soon as you change the height of a color bar with
the mouse).
You may modify the colors by clicking into the histogram - single points
or lines (see "tricks" below).
Click on the "Undo"-Button to exit from the Color Palette Editor and discard
the new palette.
Click on the "OK"-Button to activate your new color palette and return to
the main window.
You may SAVE your new color palette as a file from the "File"-menu of the
spectrum window (where you can also LOAD color palettes from disk). But you
don't have to save the "current" color palette after changes, the program
will do that automatically (it saves the currently used palette in a file
named "CURRENT.PAL").
The "original" built-in color palette is a kind of "rainbow" sweeping from
BLACK (0 dB) across GRAY to BLUE, GREEN, YELLOW, RED to WHITE (100dB). The
color palette can be "stretched" and "shifted" with two sliders on the
"spectum/waterfall" window - so you don't need to edit the color palette
to modify the waterfall's "contrast" and "brightness".
A few "tricks" using the color palette editor...
To modify a group of adjacent colors in the palette, first define which of
the three color components (R,G,B) you want to change in the three
"Control"-check marks on the left side of the Color Palette Editor.
If you activate all three check marks and then move the mouse slowly across
the histogram window (with the left mouse button held down) from the lower
left to the upper right corner, you will produce a gray scale because the
R,G and B component of every bar you touch will be set to the same height
(R=G=B, because all three channels activated).
The intensity of every color bar you "touch" with the mouse will be set to
the Y-coordinate of the mouse.
The X-coordinate of the mouse defines which of the 255 colors is set.
To create a smooth "color sweep" from RED to BLUE you would first reset a
group of adjacent colors to BLACK, then turn on the RED control only, create
a falling RED scale, turn the RED control off and the BLUE control on and
create a rising BLUE scale (on the same range of color indices).
To achieve a smooth gradient (or slope, or line), set the edit mode to "lines"
(by default, it's set to "points"). Then move the mouse to the start point.
Press and hold the left button, and move the mouse to the end point. This
way you can easily achive any possible colour gradient in the palette.
back to top