 |
 |
Noise figure (NF) is a standard way of measuring the noise level of an RF system above thermal noise.
The power equation for thermal noise is: Pn = kTB.
Assuming a 50Ω system with B = 1 Hz, T = 290°K, where Boltzmann's constant k = 1.38 × 10⁻²³ Joules/°K,
then Pn = -174 dBm/Hz. This is the thermal noise power. (290°K = 17°C).
At the standard temperature T = 290°K, the system noise floor is defined as follows:
Noise floor = (NF + 10log10B - 174) dBm where NF is expressed in dB.
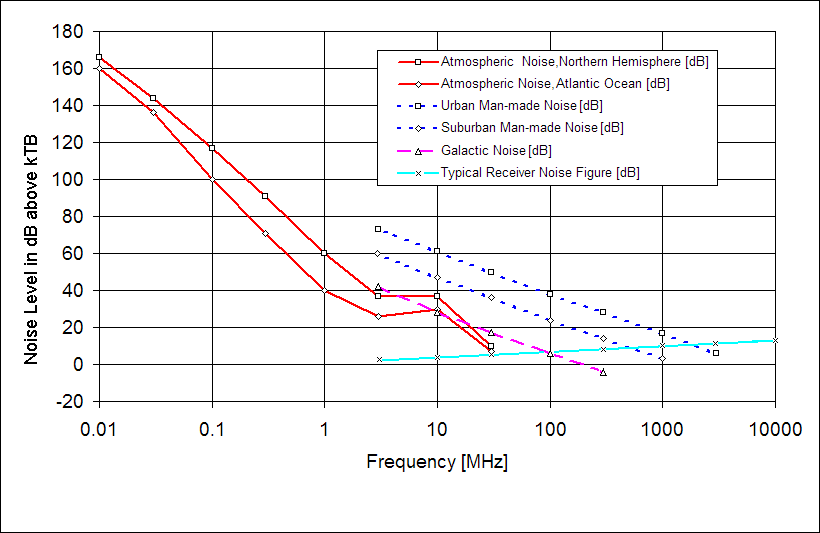
HF reception, in the range 1.8 - 30 MHz, is often externally noise-limited due to galactic (sky), atmospheric and/or man-made noise. The curves in Fig.1 illustrate the effective contribution of these noise sources, expressed in dB above thermal noise.
To ensure that it is always externally noise-limited, an HF receiver system, located at a quiet radio site and operating at the higher end of the HF range, should have NF < 16 dB. This is equivalent to a -158 dBm/Hz noise floor, or a sensitivity spec. of -113 dBm (0.5 µV) for 10 dB SINAD in a 3 kHz bandwidth.
As can be seen from Fig.1, this is a limiting situation at HF, and in many cases, modest overall receiver system sensitivity can be tolerated without compromising system performance. It should be remarked, though, that additional receiver sensitivity is still useful to overcome losses in the antenna, feedline, preselector and so forth.
ITU-R (CCIR), "World distribution and characteristics of atmospheric radio noise," Report 322, 1964.
"Reference Data for Radio Engineers", 5th ed., Chapter 27, "Radio Noise and Interference", Howard W. Sams & Co. Inc.
Copyright © 2006 A. Farson VA7OJ/AB4OJ. All rights reserved.
Last updated: 10/17/2007