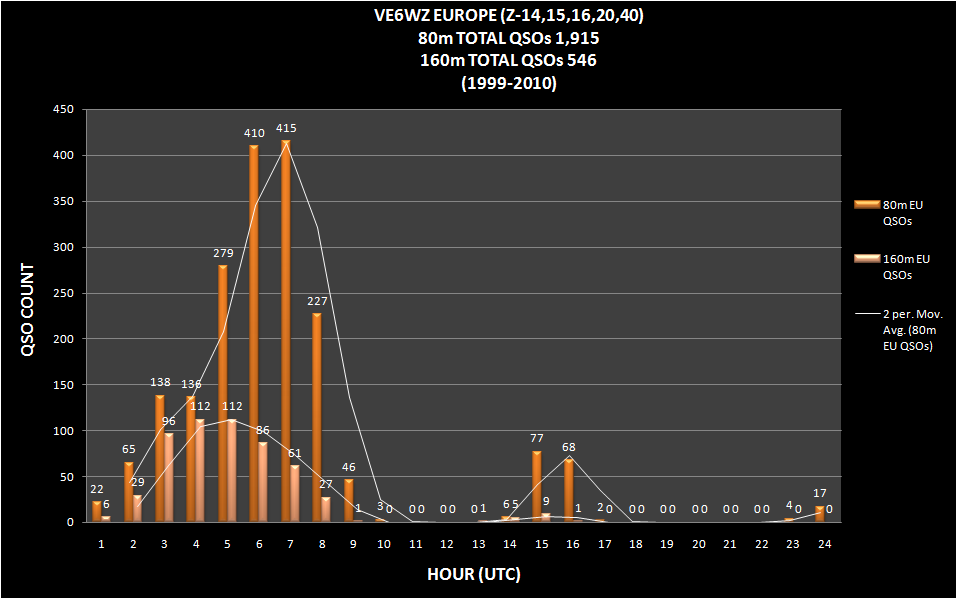
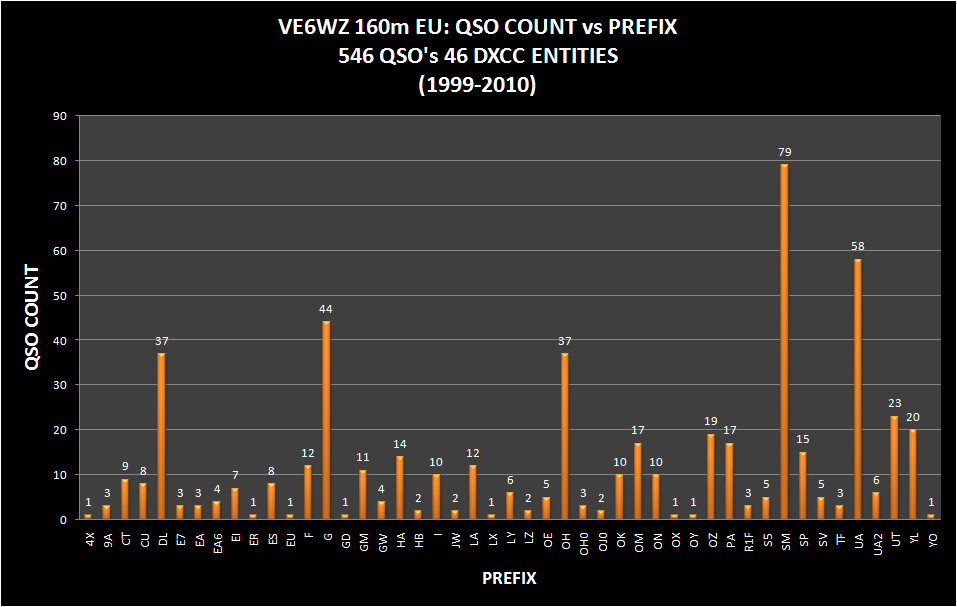
Below is an Excel chart showing the EU QSOs on both 80 and 160m for the 10 year period from 1999-2020. The data is an extract from the log since 1999, sorted by band and then zone to filter out only trans-polar EU QSOs. A pivot table was built and QSO count vs UTC time was plotted. The 2nd and 3rd charts show the distribution of DXCC entities worked for each band. In the data set are 1,915 80m EU QSOs, and 546 160m EU QSOs.
For 80m, it seems clear that the peak time for EU DX is between 0600z and 0700z with the moving average peak at 0700z. Between 0600-0700z, 825 EU QSOs or 43% of ALL QSOs were made during this 2 hour period. From 0500 to 0900, 1377 or 72 % of all EU QSOs were made at this time. Only 19% or 361 total QSOs were made before 0500z. It seems like to maximize EU DX on 80m, you need to be at the radio AFTER 0500z.
For 160m, it seems that “later is not really better”. The moving average QSO peak is at 0500z, with 41% (224) of the QSOs occurring between 0400-0500z. AFTER 0500z, only 32% of the total QSOs were made, compared to 80m where 72 % of the QSOs were made after 0500z!
I think the reason for this difference is because 160m does NOT show extended post SR propagation, whereas on 80m, the band can (and usually does) remain open up to 1-2 hours AFTER SR. Here on 80m I find that the best morning SR propagation on 80m is .5 to 1 hour AFTER SR. Signals to Asia often show a very pronounced peak, sometimes with outstanding signals and frequently as late as 2 hour after SR. (Here are some plots showing 80m QSO's together with the VE6 sunrise: 80m SR_Plots ) The sun is often well above the horizon and shining brightly as the signals continue to peak. Therefore, it would seem likely that this same phenomena in EU would tend to extend and “smear-out” the opening to allow more of EU to have propagation. On 160, as the terminator passes each country as the sun-rises, the band is closed, and the only DX left to work are those still in darkness.
I also think that EU activity (and therefore QSO count) is driven by operator sleep patterns. Certainly there are some dedicated DXers who will get up at 3-4am to work DX, but realistically, most probably just “check-out” the radio after they get up and before they go to work. Even if it is past SR, 80m will still be open. This could be a reason for the later 0700z QSO peak on 80m.