AUDIO SPECTRUM ANALYZER
WITH THE PC SOUNDCARD
(2004)
KLIK HIER VOOR DE NEDERLANDSE VERSIE
What can you do with an audio spectrum analyzer?
Below are some examples of what you can do with an audio spectrum analyzer (or spectrogram) program and the soundcard.
Examples of very good spectrogram programs with correct dB scales are GRAM by R.S. Horne. I tried Version 5.1.7. It has various display possibilities like Waterfall, Bar and Line. The average function is very useable for adjustment of (ladder) filters.
Another program is WaveSpectra with spectrum and oscilloscope function. Average is less suitable for adjustment of filters
because the trace is not continuously updated but only after the selected number traces.
Miguel PY2OHH, thanks for sending me these nice programs!
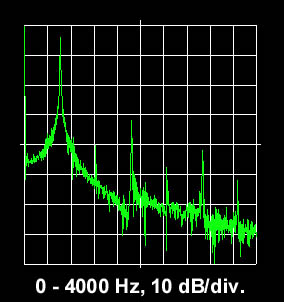
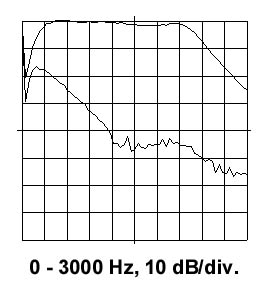
Normal mode for displaying an audio signal and it's harmonics.
The relative levels in dB's can be measured, 1 division is 10 dB.
It is also possible to check the accuracy of an RF attenuator if
you switch off the AVC of the RX and tune it to a stable CW signal.
|
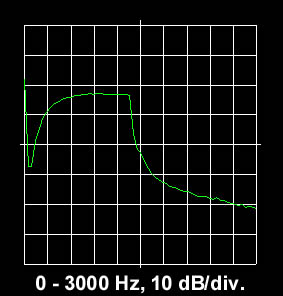
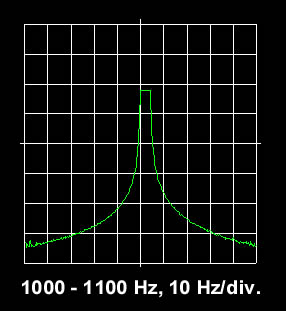
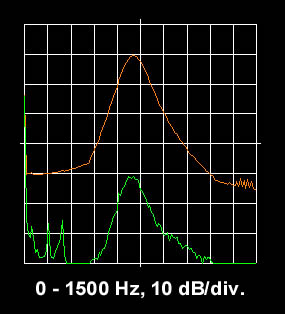
Peak mode for displaying the frequency response of a bandfilter.
Tune the receiver slowly over a stable CW signal from a crystal
oscillator or calibrator. Here half way the measurement.
|
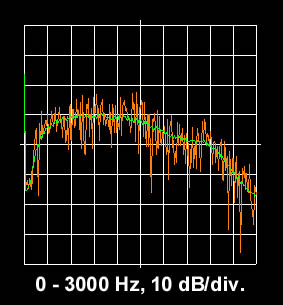
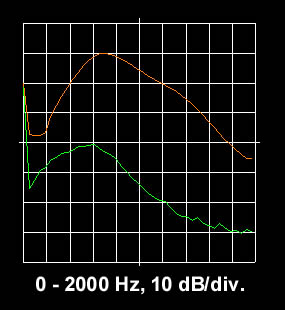
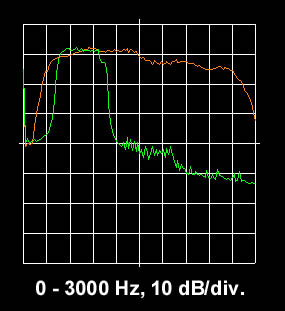
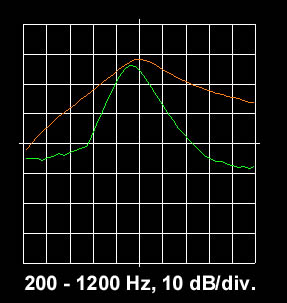
Average mode for ladder filter adjustment with a noise source.
Here the unuseable normal mode signal (orange trace) and the
average mode signal (green trace) of a bandfilter curve.
|
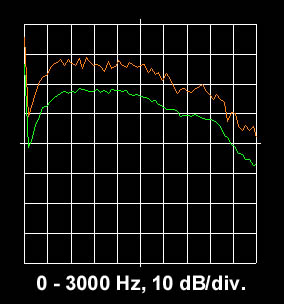
Connect your receiver with a noise source (or antenna!) and
start with a low average value and 1024 samples (orange trace).
If the curve is adjusted close to the desired one, increase the
average value (green). The curve is displayed better but will
follow your adjustments slowlier.
|
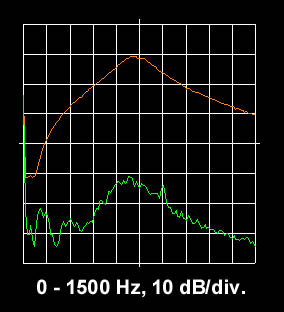
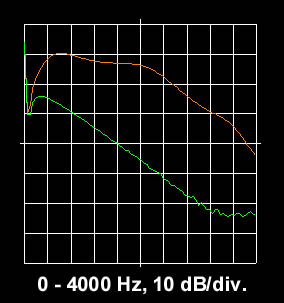
Measurement of the filter curve and the suppressed side band of
the 40-30 CW QRP rig. The bandfilter curve is the orange trace,
the green trace is the suppressed side band (more than 30 dB!).
Measured by tuning over a CW signal in maximum hold mode.
|
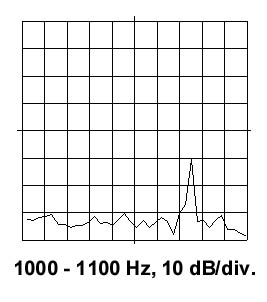
Measurement of the frequency stability of the all band QRP CW TRX.
It is tuned to a crystal calibrator signal while the audio is monitored
with the maximun hold mode during 5 minutes. Drift is approximately 5 Hz.
|
SIMPLE AUDIO SPECTRUM ANALYZER
PROGRAM FOR THE PC SOUNDCARD
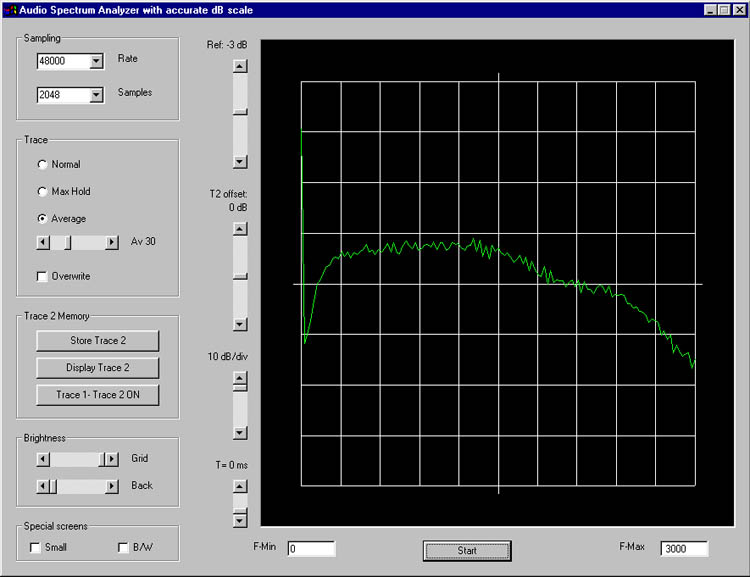
Simple audio spectrum analyzer for adjustment of filters and other measurements.
One of my plans was to try to make such an audio analyzer program but I did not know how to read the audio files in the computer. However on the internet the Visual Basic source code for a waterfall and simple spectrogram was found. This source code was for me the basis for this simple audio spectrum analyzer with accurate dB scale, maximum hold and average functions to measure and adjust band filters.
I had a lot of fun with all the programming, experiments and trials with this program. If you want to do experiments with modifying the source code, that code is also given here below. It is simple and has only one FFT routine, the rectangular one.
How to use the audio spectrum analyzer
SAMPLING
|
The RATE should be as high as possible as frequencies above the (samplerate/2) can cause false displayed signals below that frequency. Only lower the sample rate if you want to have a very high frequency resolution, but be shure that there are no signals with frequencies higher than the (samplerate/2) in the input signal. Perhaps a low pass filter is required.
The SAMPLES can be selected in accordance to the desired resolution. A low number gives a low resolution but a faster update of the screen. A high value of the samples a high resolution (comparable with a low bandwidth of the analyzer) but a low update of the screen.
|
TRACE
|
When NORMAL is selected, the trace is updated with the actual values of the input signal. This mode is very suitable for measurement of harmonics, variations in dB's etc.
The MAX HOLD mode updates the trace only with a new value if the new value of the current position is higher than the old value. Very suitable if you want to record the maximum values during a certain period or for measuring bandfilter curves by tuning your receiver slowly over a continuous wave (AVC switched off!!). Clear Max Hold by selecting Normal again.
The AVERAGE mode updates the trace with a fraction of the difference of the new value and the old value of the current position. This gives an average effect. For a value of 100, the new value is changed by 1/100 of the difference (in dB). Very useful to do measurements with a noise source, the noise is averaged as a smooth trace instead of one with many high and low peaks.
The OVERWRITE is a hardly used feature. The trace is not cleared and all written traces are shown on the screen.
|
TRACE 2 MEMORY
|
With STORE TRACE 2 the current trace is stored into the trace memory.
With DISPLAY TRACE 2, the trace is displayed in the color orange.
TRACE 1 - TRACE 2 ON is something you will perhaps never use. The green trace is now the result of the current input value minus the memory value. It can be used to see if something has changed.
|
BRIGHTNESS and SPECIAL SCREENS
|
With these options it is possible to change the brightness of the grid and background and to select a small screen in color or black and white. I used it to make the pictures shown here of the various measurement. Press the Print Screen key of your keyboard and paste it into a new Paint document. Cut the analyzer screen from the picture with a picture editor and add the text. Select B/W (Black and White) if you want to print it on paper.
|
REF, T2 OFFSET. DB/DIV, T=0 ms CONTROLS
|
With REF you can shift the traces up and down with a certain dB value.
T2 OFFSET is an adjustable offset between the traces (green trace and orange memory trace).
DB/DIV changes the vertical resolution of one division.
T=0 MS is a special feature. It is the sleep time between two trace readings. Some computers do not work correctly when T=0. Some do show continuously the same trace with low SAMPLES selected, others show some random traces. If you have that problem, set T to 50 or 100ms (or perhaps more when a high number of samples is selected) to overcome this problem. Also suitable if you want to have a low refresh rate for the trace.
|
FMIN, START and FMAX
|
Just type the desired start frequency (Hz) in FMIN and stop frequency in FMAX. The highest measured frequency is the (samplerate/2).
Press START to start!
|
Software
CLICK HERE FOR THE NEWER, IMPROVED VERSION OF THE SPECTRUM ANALYZER SOFTWARE
The most recent version is V1.1. Thanks to Claus DL7QY, the flickering in the display has been solved.
Program for a 1024x768 screen:
Download the 04AUDIO1.ZIP (14k) file containing only the executable.
Download the 04AUDIO2.ZIP (8k) file containing the complete Visual Basic Project.
Program for a 800x600 screen:
Download the 04AUDIO1_800x600.ZIP (14k) file containing only the executable.
Download the 04AUDIO2_800x600.ZIP (8k) file containing the complete Visual Basic Project.
Original program:
Download the 04AUDIO3.ZIP (8k) file containing the original Visual Basic Project I used for my program.
How to connect and control the soundcard
Connect the output of your receiver to the input of the soundcard via a 10k ohm resistor. Connect a 1k ohm resistor in parallel with the input of the soundcard so that the signal is attenuated by approximately a factor 10 due to the resistive divider of the 10k/1k resistor network. If that is too much, do not connect the 1k resistor but always use the 10k resistor to avoid damaging the soundcard.
You have to select the desired input via the Windows Volume Control! Do that via OPTIONS=PROPERTIES=RECORDING and press OK if you have selected the inputs you want to be shown. If you want to use the line input, deselect especially the microphone input (too much noise!) and also the others!
More measurement examples
The WIDE CW filter curve (orange) and the suppressed sideband (green)
of the 4 band CW transceiver with phasing method to suppress the
sideband. It is indeed 40 dB without a crystal filter!
Measured by tuning over a CW signal in Max Hold mode.
|
The NARROW CW filter curve (orange) and the suppressed
sideband (green) of the same CW transceiver. Also 40 dB!
|
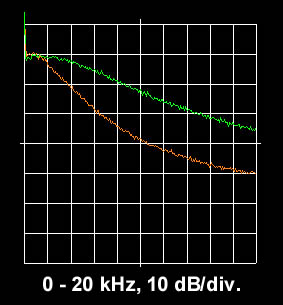
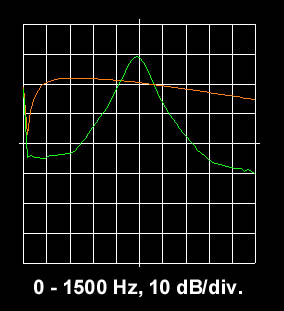
The regenerative receiver in wide and narrow mode.
Measured with atmospheric noise and the average mode (100).
|
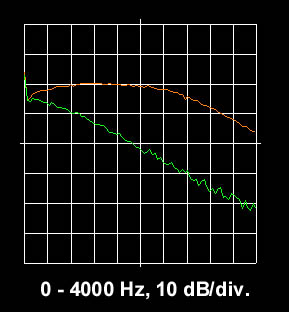
The SSB filter and suppressed sideband of an old SSR1
general coverage receiver with 455 kHz ceramic filters.
Not so good but good enough for my first shortwave QSO!
|
The 36 MHz ladder filter of the new shortwave receiver adjusted
for maximum side band suppression and the green suppressed
side band trace.
|
The 36 MHz ladder filter of the new shortwave receiver adjusted
for maximum flattnes and the suppressed side band trace.
The display is switched to Black and White mode.
|
The SSB (orange) and CW (green) filter of an old TS520
combined in 1 picture. No comment.
|
This tone was absolutely inaudible but still 20 dB above
the noise floor of the audio analyzer!
|

The 48 MHz ladder filter of my first shortwave receiver
and the suppressed side band (green trace) in USB.
|
The same filter, now in LSB. Side band suppression of
a ladder filter is not so good if the BFO frequency is
at the lower edge of the filter. (see USB picture).
|
The audio CW filters (wide and narrow) of my first
shortwave receiver, center frequencies have to be adjusted!
|
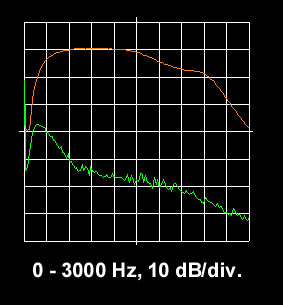
The wide and narrow audio filters of the all band TRX.
The wide filter is also suitable for SSB reception.
|
BACK TO INDEX PA2OHH