A Low Pass RF Filter in an Altoids BoxDesign and Construction of a Low Pass Filter for the Low Frequency RF Spectrumby Dr. Carol F. Milazzo, KP4MD (posted 28 August 2011) INTRODUCTIONMonitoring non-directional beacons (NDBs) and other transmissions on frequencies below 530 kHz may be difficult in urban locations due to the overloading of the receiver front end by nearby powerful AM broadcast transmitters in the 530-1700 kHz medium frequency band. I reside in the Sacramento, California area, within 15 miles of 50,000 watt broadcast stations on 1140 kHz (KHTK) and 1530 kHz (KFBK), and several stations operating at 25,000 watts and lower levels with high field strengths due to their close proximity1 (see Table 1). These all produce strong images and intermodulation products that have interfered with the reception of signals below 540 kHz. |
|
|
|---|---|---|
|
This article describes the construction of a low cost
low pass radio frequency filter that was designed to
reduce interference from AM broadcast stations. It
is suitable for use with long wave receivers and low
power LowFER transmitters. This construction
technique may be adapted for filters on other frequency
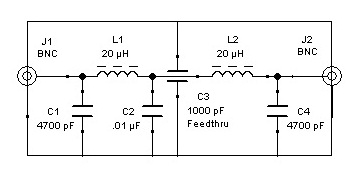
ranges. DESIGNING THE FILTERIn 1984 I had written, published and explained two BASIC language computer programs2,3 for the design of Butterworth and Chebyshev filters. Since then numerous filter design programs and calculators have become available on the internet. From these, I selected the online LC Filter Design calculator by Tony Fisher of the University of York.4 I specified a 5-pole low pass Chebyshev filter with 0.01 dB ripple, 3 dB attenuation at 510 kHz and 50 ohms impedance. The calculator yielded the circuit in Figure 1 with
component values of 4720 pF, 20 μH and 9840 pF. I
would substitute standard value 4700 pF and 0.01 μF
ceramic disc capacitors. The two halves of the
filter would be connected with a feed through capacitor
through a separating metal shield to further isolate the
input from the output. As I only had a 1000 pF
feed through capacitor, I would connect the 0.01 μF disc
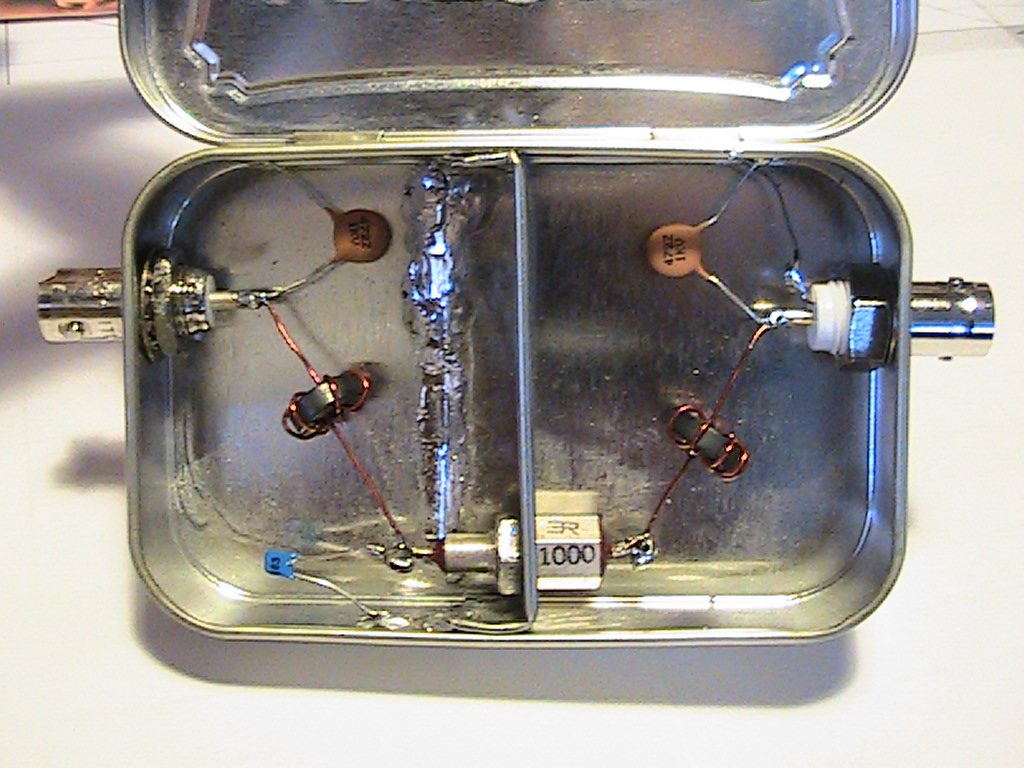
capacitor in parallel with it. BUILDING THE FILTERThe filter was built inside a 20 mm x 58 mm x 93 mm disposable steel Altoids mints box (Figure 4). This box had appropriate dimensions, was easily machined and had easily soldered surfaces. Northrup has also constructed various projects with these boxes.5 Figure 2 shows the filter construction. Holes were drilled for the single hole BNC female chassis mount connectors and the central metal shield was cut with metal shears from a spare Altoids box, measured, formed and drilled for the feed through capacitor. The shield flanges were sanded to remove the external paint and then easily soldered into the box. The online calculator at http://toroids.info/6 was used to determine the number of windings that were required for the inductors. Using some FT37-43 toroid cores that were available at a local Fry's Electronics store, it was found that 8 turns of wire would give 22 μH inductance. These were wound with some 22 AWG enameled wire that was on hand and soldered from the center pin of each BNC connector to one end of the feed through capacitor. The ceramic disc capacitor leads were trimmed and soldered to their respective connections. Good solder joints were easily made to the box without much heating. FILTER OPERATIONFigure 4 shows the predicted attenuation in decibels over the frequency range from 0 Hz to 10 MHz. It shows no filter attenuation from 0 Hz through 500 kHz and attenuation increasing to nearly -60 dB at 2 MHz. The attenuation should be nearly -35 dB at 1140 kHz and -50 dB at 1530 kHz. With the filter placed in line between the receiver and antenna, there was no perceptible decrease in signal strengths below 500 kHz. Table 1 compares the strengths of the received signals as they were measured using a FlexRadio FLEX-3000 with and without the use of this low pass filter and a subsequent 5-pole elliptical bandstop filter.7 Figures 5 and 6 show the filter characteristic measured with a miniVNA Pro vector network analyzer. For comparison purposes, I would consider a 7-pole low-pass filter similar to the designs of Button8, Gale9,10 and Tucker11 but using the above described construction technique with isolating shields and feed through capacitors. The use of feed-through capacitor coupling and shielding between filter sections should increase high frequency attenuation. Filters for low frequency reception are also available commercially 12,13,14,15. |
|
|
 Figure 1. Filter Schematic Diagram |
||
 Figure 2. Filter Construction |
||
|
Table 1. Filter Attenuation vs. Frequency |
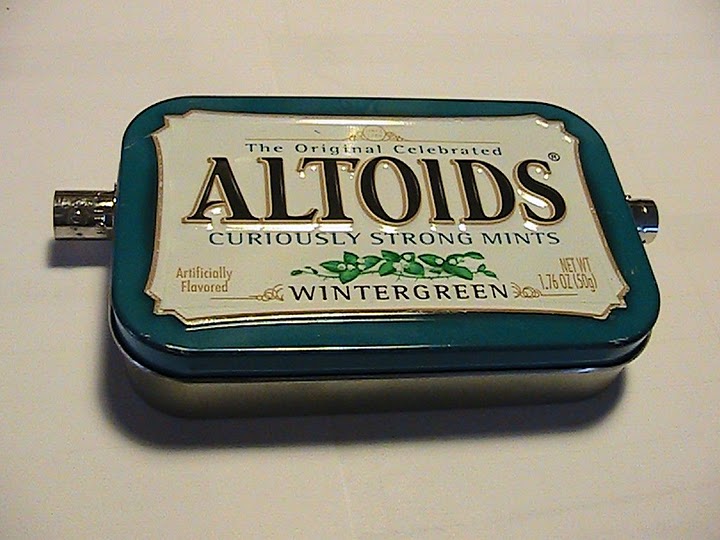
 Figure 3. Low Pass RF Filter in Altoids Box |
|
REFERENCES
|
Figure 4. 5-pole Chebyshev Low Pass Filter Model and Calculated Frequency Response Curve |
|
 Figure 5. Attenuation vs. Frequency Measured with VNA |

Figure 6. VNA measured filter response curve of the 5-pole Chebyshev low pass filter. |
|