Spectrum Lab troubleshooting, known bugs and more...

Contents

  1. Spectrum Lab's Error History
  2. CPU Load Display
  3. The 'Debug' tab
  4. The 'Misc' tab ("Miscellaneous Info" for debugging)
  5. Communications / CAT traffic monitor / Icom LAN/WLAN
  6. How to report bugs
  7. Running the program in "debug"-mode, producing a logfile
  8. Windows related issues...
    1. More "fun" with Windows 10 : USB audio devices are DISABLED and no longer displayed
    2. Even more "fun" with Windows 10 : No more audio from the soundcard due to 'Privacy Settings'
  9. Buglist (moved to the SL User's group)
See also: Spectrum Lab's main index (separate file)

1. Spectrum Lab's Error History

Spectrum Lab's own (internal) Error History is one of the first things you should check if the program behaves strange, audio isn't ok, input signal are not displayed, etc.
To open the error history, select 'View/Windows' in SL's main menu, then click on 'Error History'.
The error history is displayed in one of the tabsheets in a window titled 'Debugging Display':


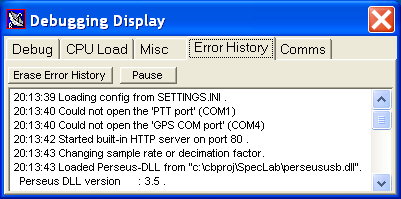
Screenshot of SL's Error History display window,
showing a few 'minor problems' after launching

Note: The 'error history' also shows additional information which may help debugging.
Not all lines in the error history are actually errors. The 'real' errors can also be logged to a file, as explained in another chapter.

Real error messages are displayed with a red background.
Warnings (e.g. suspicious parameters) have a yellow background.
Everything else (debugging info, etc) uses the default white background, as in the older screenshot shown above.

When 'real errors' occurr, the error history automatically pops up, unless the option 'auto-open' (on the Error History tab) is unchecked.

2. Spectrum Lab's CPU Load Display

When running certain applications in Spectrum Lab, the CPU may not be fast enough in some cases.
The total amount of CPU time (percentage) can be examined in the windows task manager (or whatever Microsoft decided to call it today..), but the task manager cannot tell you which of the different threads and functions in Spectrum Lab consumes the most CPU time (and thus can be optimized to reduce the CPU load).
To open SL's own CPU load indicator, select 'View/Windows' .. 'CPU load' in the main menu.
This opens another tab in the 'Debugging' window, which may look as shown below:


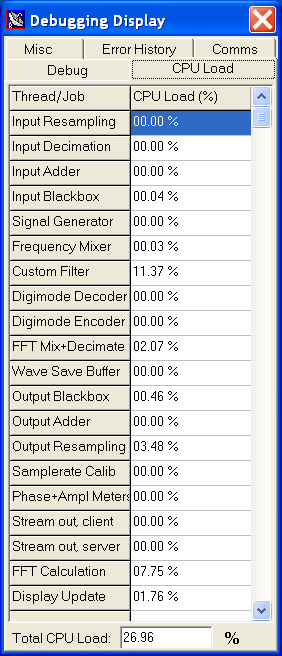
Screenshot of SL's CPU load display

Note: As most windows in Spectrum Lab, the 'Debugging' window is sizeable.
The 'total CPU load' percentage, shown at the bottom of that window, assumes that all threads are running on a single core (CPU). Because the audio processing, the FFT calculation, and the display update may run in different threads on different cores (in a multi-core CPU), the 'total CPU load' may exceed 100 percent without problems on such machines.


3. The 'Debug' tab

The 'Debug' tab on SL's 'Debugging Display' window shows a few internal variables, and can be used to invoke certain test procedures (e.g. "stress tests"). It is not intended for normal use. Thus only a short summary here:

TxErrors : Error counter for output to the soundcard,
           or similar output device.
OutBuff  : Output buffer usage (feeding the soundcard, etc).
OutStat  : Status of the output device / last error text
RxErrors : Error counter for input from soundcard, SDR, etc.
InBuff   : Input buffer usage (fed by soundcard, SDR, etc).
InStat   : Status of the input device / last error text
LostIn   : Lost input buffers, caused by audio thread
           not being serviced for too long.
LostOut  : Lost output buffers, i.e. output device running
           out of samples, for dozens of possible reasons.
Analyser FFT calculation time : Average calculation time
           of the main spectrum analyser's Fourier Transform.
Graphics : Pixel format used by the graphics card.
           These days, always 32 bit/pixel. 
Alloc'd  : Memory size currently allocated by the program,
           and number of dynamically allocated memory blocks.
TimerFreq: Frequency of a hardware timer in the CPU,
           used for internal timing and speed tests.
[ ] use OutputDebugString() : Only useable when running
           the program under debugger control. When checked,
           error messages (and/or entries for the 'debug
           run log') will also appear in the debugger's
           console window.
TEST (button): Can be used to invoke built-in test functions,
           controlled by the 'mode' value (edit field):
    mode 0 : None of the tests listed below is active.
    mode 1 : Add a 'test signal' to the input from certain
             software-defined radios, early in the
             signal processing chain.
    mode 2 : Let the signal processing thread freeze
             for a few seconds (but not the GUI thread).
             This was used to check the behaviour after
             audio buffer over/underflows, etc.
    mode 3 : Let the GUI thread freeze for a few seconds.
    mode 4 : Provokes an 'access violation' (exception).
    modes 5..100 (?) : Lets BOTH the GUI-thread, and the
             signal processing thread freeze for the
             specified number of seconds.
             Causes a lot of buffer over/underflows
             in the audio processing and TCP/IP network.
             The program should survive any of
             these, without crashing.


4. The 'Misc' tab ("Miscellaneous Info" for debugging)

This tabsheet of SL's "Debugging Display" is a simple text display, periodically updated. The content greatly depends on the types of the currently active input- and output device. For operation with a 'normal' soundcard, this display is almost irrelevant. But if, for example, the input originates from a microcontroller-driven A/D converter connected to SL via 'COM' port (real serial port or virtual COM on USB), the display gives an overview of what goes on 'under the hood' at the moment. Example (with Audio input via COM port):

Input: COM12, 1000 S/s, 2 * 16 bit/sample, 115200 baud, S16,SYNC.
  Raw: 05B805B7 0BBC8000  0BBC8000 80000BBB  80000BBB 0C450C44  0C450C44  
  Buf: 8 %, free: 476 samples, used: 37 samples 
  I/O: 908932 bytes rcvd, 37568 packets rcvd, 146577 SYNCs rcvd, 26 garbage bytes, 
       90 195 206 208 180 219 187 195  bytes/loop .
  Thd: 1222 loops; 30757 30916 31272 31560 31020 30595 31142 30351  us/loop .
 Rate: 5924 byte/sec received, 0 byte/sec sent.
  Log: 888 kByte written to logfiles\audio_via_com_log.bin.
       Errors at 0x00090032,0x00090035,0x000B378D,0x000B3790,0x000BC409,0x000BC40C,0x000D40DF,0x000D40E2.
Output: 1 Lautsprecher (Realtek High Defi, 1000 S/s, 2 * 16 bit/sample.
  Raw: 0000 0000  0000 0000  0000 0000  0000 0000  0000 0000  0000  
  Buf: 50 %, free: 512 samples, used: 512 samples 
       0 0 0 0 0 0 0 0  bytes/loop .
  Thd: 0 loops; 0 0 0 0 0 0 0 0  us/loop .
 Rate: 0 byte/sec sent, 0 byte/sec received.
Processing sample rate: 1000.0 Hz
FFT-feeding buffer(s), 2 channel(s) : 
 Channel #1: 8192 points = 200 % of FFT size (4096)
  FFT Decimator chain: M = 1 (off)
  Output sample rate : 1000.0 Hz
  Buffer usage       : 8192 of 8192 samples
  Age of samples     : 09.8 .. 18.0 sec (newest, oldest)
 Channel #2: 8192 points = 200 % of FFT size (4096)
  FFT Decimator chain: M = 1 (off)
  Output sample rate : 1000.0 Hz
  Buffer usage       : 8192 of 8192 samples
  Age of samples     : 09.8 .. 18.0 sec (newest, oldest)
Waterfall scroll interval: 40.0 sec
Spectrum Buffer : 
  IndexOfLatestEntry : 2
  IndexOfOldestEntry : 0
  NumLinesBuffered   : 3,  max = 4053
  RAM usage in kByte : 65552
Configuration file: SETTING2.INI (contains USER- *and* MACHINE-settings)
The exact format of messages printed into the 'Misc' tab (as shown in the example above) is 'subject to frequent change'. Thus most messages are not documented or explained in this manual (but most messages should speak for themselves). Only some of the output shown above (e.g. the meaning of 'garbage bytes') are explained in the document about troubleshooting Audio-via-COM/UDP/TCP.

Text can be easily copied as such (not as a graphic image) from the 'Misc' display. To stop the text editor from being periodically updated (which makes it difficult to select a part the text with the mouse for copying), right-click into the text to open the following context menu:

Check menu item 'Pause update (to select lines, for copy & paste)'
to temporarily pause the periodic update of text in the editor. This allows to select parts of the text (output), e.g. to copy (CTRL-C) and paste (CTRL-V) it into an email, or for software documentations. The same applies to other tabsheets in the 'Debugging Window', presented in the following chapters.


5. Communications / CAT traffic monitor

During the development of remote control for certain radios (e.g. CAT = 'computer aided transceiver'), a simple protocol monitor was added in Spectrum Lab's 'Debug' window. It can be opened from the main menu under View / Windows, Communications / CAT traffic monitor.


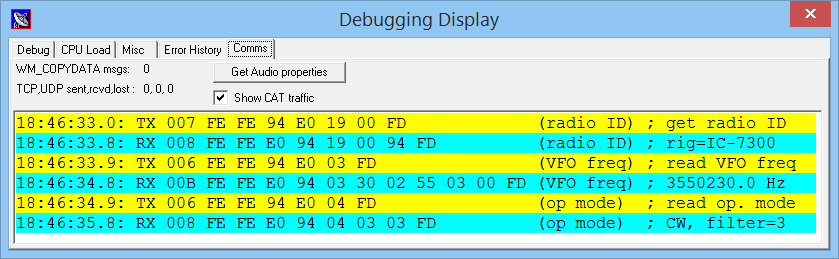
Screenshot with the 'CAT traffic monitor' enabled (old display format)

"RX" (receive, cyan background) and "TX" (transmit, yellow background) must be seen from the PC's point of view. If the radio responds with an error (in CI-V : "Not Good", command 0xFA), the message is marked with a purple or red background.
Note:
The message display uses a standard 'Rich Edit' text control. Text can be marked copied into the windows clipboard. With a suitable text processing software, even the highlighting colours are preserved when pasting text, and converting the clipboard into HTML for documentation (shown as text, not graphics, below).
Alternatively, instead of copying / pasting individual lines of text, the entire CAT traffic log can be saved as a (Rich) Test file. Right-click into the CAN traffic log to open the context menu shown below, then select then select e.g.


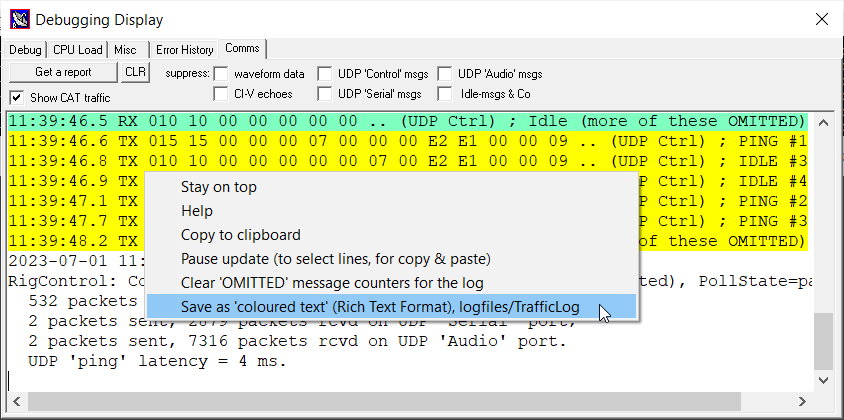
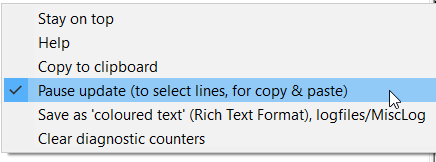
'CAT traffic monitor' with context menu for the 'Rich Text' editor.

The program doesn't ask 'where to save' the traffic log. Instead, it composes a filename beginning with e.g. "TrafficLog_" (if the right-clicked editor was the 'CAT Traffic Monitor'), followed by date and time (format YYYYMMDD-hhmmss), and the file extension ".rtf" because that's the only format directly supported by the old 'RichText' control in Borland's VCL that will keep the text- and background colours intact. If Spectrum Lab was installed into the recommended folder, a 'traffic log' saved this way in 2023-07-01 on 11:06:44 UTC would be in
C:\Spectrum\logfiles\TrafficLog_20230701_110644.rtf .
An example file (with UDP traffic from an IC-705) is included in the installer, and explained here.
Any decent text editor can load / copy & paste this format.
On a Windows PC, RTF files can be opened with e.g. "WordPad". You may have to turn off 'word wrap' ('Zeilenumbruch'), to have exactly one message per line displayed, even if they don't fully fit on the screen initially. Then, still in "WordPad", click "Zoom In" / "Zoom Out" until the lines (which, btw, all have the same length) fit inside the window.

Especially with Icom's THREE UDP PORTS involved in the client/server communication, there are certain messages (like "PING") that appear very frequently. The CAT traffic monitor will omit such messages after they were listed for a few times (in the 'log'), to prevent them from flooding the log. For that purpose, there are various counters for certain types of messages (e.g. PING and IDLE messages on any of the tree ports). If a counter exceeds a certain value, the CAT traffic display adds an comment like "(more of these OMITTED)", and does NOT show such messages in the log. They can be temporarily be displayed again by selecting "Clear 'OMITTED' message counters for the log" in the context menu ("right-mouse-button menu") shown above.

Other manufacturer's CAT protocols (incompatible with Icom's CI-V; what else did you expect) were so poorly documented, plagued with errors or ommisions, or incompatible even after just a simple firmware update, that there are no plans to support them in the foreseeable future. As someone wrote in a blog...
> Icom kept the same protocol across its many transceivers,
> while Yaesu generally wrote a new protocol for every new radio.

5.1 Normal Ci/V traffic (Icom radios with serial port or USB)


18:46:33.0 TX 007 FE FE 94 E0 19 00 FD             (radio ID) ; get radio ID   
18:46:33.8 RX 008 FE FE E0 94 19 00 94 FD          (radio ID) ; rig=IC-7300    
18:46:33.9 TX 006 FE FE 94 E0 03 FD                (VFO freq) ; read VFO freq  
18:46:34.8 RX 00B FE FE E0 94 03 30 02 55 03 00 FD (VFO freq) ; 3550230.0 Hz   
18:46:34.9 TX 006 FE FE 94 E0 04 FD                (op mode)  ; read op. mode  
18:46:35.8 RX 008 FE FE E0 94 04 03 03 FD          (op mode)  ; CW, filter=3   
18:46:35.8 TX 008 FE FE 94 E0 27 11 00 FD          (sp-ctrl)  ; stop spectrum    
18:46:36.8 RX 006 FE FE E0 94 FB FD                (OK)                        
|__UTC___| |    | |___| |  |  |  |     |_______ _ _ (info)    ; comment or
         Dir Length |  Dst/Src|  Sub-command(s) |               decoded value
    FE = CI-V preamble  Addr. Command  or data  FD = CI-V postamble (message delimiter)
The messages above show a typical CAT control sequence (Icom:CI-V) shortly after starting.
The "controller" (in this case, PC running Spectrum Lab) first tries to find out the type of the connected radio by asking for it's "default CI-V address". Each Icom radio has a unique 'default adress' (in this case 0x94 which indicates it's an IC-7300).
Next, SL asks for the current VFO frequency and the 'operating mode' (USB,LSB,CW). The radio answers as expected, with the current operating mode and the filter number (1..3) in the response. If the radio supports it, additional steps may follow to configure the transmission of spectra for the broadband spectrum display.
If the 'CAT traffic monitor' doesn't shown anything, double-check the serial port (always a nuisance under Windows), serial baudrate, serial protocol, matching CI-V address, etc, as explained here. If no 'VFO freq' reports arrive in when turning the radio's VFO knob, consult your radio's manual. In an IC-7300, such 'unsolicited' reports could be configured under Menu, Set, CONNECTORS, CI-V, CI-V Transceive.

5.2 Icom radios with LAN or WLAN

Since 2021, Spectrum Lab can control certain Icom radios via LAN (Ethernet) or WLAN. In such cases, the protocol is 'a bit like CI-V', but the CI-V stream is enapsulated in a sequence of UDP packets ("datagrams"), in addition to datagrams that do not contain CI-V messages but e.g. 'control' packets to log into the radio, to exchange audio without a dreadful 'soundcard' interface, etc. At least during the log-in phase, such packets are also displayed in SL's 'CAT traffic monitor'. The automatically added comment (after the hexadecimal UDP payload display) indicates which lines of the 'traffic monitor' show CI-V messages, and which show 'other' (UDP) packets. More on controlling suitable Icom radios via LAN (e.g. IC-9700) or WLAN (e.g. IC-705) are in a different file; see 'Icom radios with LAN or WLAN'.

  'CAT Traffic' with UDP packets during the log-in phase with an IC-705
19:41:20.4 TX 010 10 00 ..  (UDP Ctrl) ; 'Connect' from port 64282 to 50001
19:41:20.6 RX 010 10 00 00 00 04 00 00 00 .. (UDP Ctrl) ; Control:CONNECTED
19:41:20.6 TX 010 10 00 00 00 06 00 00 00 ..   (UDP Ctrl) ; are you ready ?
19:41:20.7 RX 010 10 00 00 00 06 00 00 ..   (UDP Ctrl) ; Control:I-AM-READY
19:41:20.7 TX 080 80 00 00 00 00 00 00 00 1A FB 00 ..   (UDP Ctrl) ; Log-In
19:41:20.7 RX 015 00 00 00 00 07 00 C3 28 51 36 42 ..  (UDP Ctrl) ; PING #1
19:41:20.7 RX 060 60 00 00 00 00 00 00 00 51 ..  (UDP Ctrl) ; LoginResp:OK!
19:41:20.7 TX 015 15 00 00 00 07 00 00 00 1A FB 00 ..  (UDP Ctrl) ; PING #1
19:41:20.7 RX 015 00 00 00 00 07 00 00 00 51 36 42 ..  (UDP Ctrl) ; PING #2
19:41:20.8 RX 010 10 00 00 00 00 00 01 00 51 36 42 4B ..  (UDP Ctrl) ; Idle
|__UTC___| | |__| |__ hex UDP payload, usually truncated (protocol info) ; comment 
           | Length (of the UDP payload)
          Direction (TX=sent from Spectrum Lab's point of view; RX=received)
 Protocol Info: 
   (UDP Ctrl)   = packets for/from Icom's "Control" port (e.g. UDP port 50001)
   (UDP Serial) = packets for/from Icom's "Serial" UDP port  (e.g. port 50002)
   (UDP Audio)  = packets for/from Icom's "Audio"  UDP port  (e.g. port 50003)
 Lines without any of the above 'Protocol Infos' in parentheses
 show CI-V payload, extracted from UDP packets or from virtual COM ports.

If there's trouble with a certain (CI-V compatible) radio, please copy the content of the 'CAT traffic monitor' in your message posted to the Spectrum Lab user group. With some luck, it may be possible to modify the CI-V parser to make it 'understand' the new message type.

6. How and where to report bugs

If you encounter any problems with this program, follow these steps..

  1. Read the manual or online-help system.
  2. Don't miss the chapter "System Requirements and Installation".
  3. Please Check For Updates before wasting your (and my) time searching for a bug which has possibly been fixed already.
  4. Visit the SL User's group and check if the problem is already known, and if there is some kind of work-around.
  5. Try to install the program on an other PC and try if the problem occurs on that PC, too
  6. Reduce the sample rate, turn off all unused components
  7. Close other CPU-hungry applications that run "in the background"
  8. Run the program again, this time in debug mode, and check the logfile after a debug-run
  9. If the bug causes a program- or even a system crash, please read this (and check the error log).
  10. Check the User's Group (see link below); if the problem is windows- or hardware-related other users may have posted a workaround.
  11. If still no cure found, send me an error description via email including the following points:
The preferred method to reports bugs is via the Spectrum Lab User's Group at groups.io (formerly at yahoo, until yahoo groups became too annoying to be useful) .
You may find similar bug reports there, and possibly there is already a solution if the problem is related to a certain version of windows, or a certain hardware. If you are not using the latest version of Spectrum Lab, the author will most likely not be able to help. So, before you post a problem, make sure you have an up-to-date version as explained here.

top of page


7. Running the program in "debug"-mode, producing a logfile for post-mortem analysis

In some tough cases (were the program seems to crash, or locks up), you can help to find the problem using a special debugging feature which is built into Spectrum Lab.

When started with the command line parameter /debug, the program will produce a textfile named "debug_run_log.txt" in the installation folder (i.e. the directory where SpecLab.exe has been installed). Each line in that file is marked with the time-of-day, and a rather cryptic description of what has happened, or what went wrong (if the program had the chance to detect that before "dying"). If you create a desktop icon for SpecLab, you can modify it (right-click the icon, then select "properties" (or "Eigenschaften" on a german PC). After the path and filename of the executable, append a single space character, and the /debug switch. The result should look like this:

C:\Spectrum\SpecLab.exe /debug

Then start the program by clicking on the modified icon, or entering the above line on the windows command prompt. If you don't know how to run a program from a command line under windows: A nice how-to used to be here.
Alternatively, the installer should have added an item in the windows 'Start' menu under 'All Programs'..'Spectrum Lab'..'Run Spectrum Lab in debug mode'.
This item launches a batch file, which in turn launches Spectrum Lab with the '/debug' switch as explained above. After SL terminates, the batch file shows the contents of the debug log in an extra console window.
After running Spectrum Lab with the 'debug' switch, the first few lines in the (debug-) logfile may look like this:

19:38:45.9 Logfile created, date 2012-10-15
19:38:45.9 checking instance...
19:38:45.9 Executable: c:\cbproj\SpecLab\SpecLab.exe
19:38:45.9 Compiled  : Oct 15 2012
19:38:45.9 Data Files: c:\cbproj\SpecLab
19:38:45.9 init application...
19:38:45.9 creating main form...
19:38:46.0 Constructing main form
  ... (many lines removed here) ... 
19:38:49.7 Sound devices started
19:38:49.7 Back from InitAudioDevices .
19:38:51.1 Launching Sound Thread
19:38:51.1 Clearing digimode chunks
19:38:51.1 Clearing audio chunks
19:38:51.1 Entering audio thread loop
19:38:51.1 First call of RunProcessingChain() ..
19:38:51.1 Back from RunProcessingChain()  

If all went well, after quitting Spectrum Lab in 'debug' mode, the last lines in the logfile should look similar to this (there may be more, of course):

19:38:55.7 Beginning to close ....
  ... (many lines removed here) ... 
19:38:59.4 Deleting SPECTRUM objects
19:38:59.4 Deleting other buffers
19:38:59.4 FormClose done
19:38:59.4 Ok, all 85 dynamic memory blocks were freed.
19:38:59.4 Reached last termination step; closing logfile.

If you find strange looking lines with one of the following messages in the logfile....

... then please send me a copy of the entire logfile (debug_run_log.txt) via email, or (preferred) to the Spectrum Lab User's Group mentioned in the next chapter.

8. Windows related issues...

.. are, as you can imagine for a program that was initially written to run under Windows 98, manifold ! Especially under Windows 10, the "operating system" got a bit paranoid, and (by default) won't allow an application to save files where you (or the application) wants to have them, won't allow an application to use the microphone (even though it was you who selected the input device), etc.
Most of these issues are listed in the document titled 'Spectrum Lab Installation and program start', for example:

8.1 More "fun" with Windows 10 : USB audio devices are DISABLED and no longer displayed

Out of the blue (after a Windows 10 update, possibly "1703"), USB audio devices (codecs) were stupidly all switched to DISABLED. And, since they were now DISABLED, they were no longer listed when an application (like Spectrum Lab) tried to enumerate them in a selection list, and of course they could not be opened or used anymore. Ouch.
Cure: Open the Windows Sound tab (or 'Sounds' after right-clicking the loudspeaker icon in the taskbar, in a popup menu), which opens the dialog titled
  'Sound' with tabs 'Playback', 'Recording', 'Sounds', 'Communication'
(German: 'Sound'-Dialog mit 'Wiedergabe', 'Aufnahme', 'Sounds', 'Kommunikation').
Switch to the 'Recording' tab. Right-click into any device listed there (hopefully). Under Windows 10, a popup menu with items like
Show Disabled Devices   and
Show Disconnected Devices
should appear. Check both of them (you want to have all devices listed here, regardless if they are still disabled, and regardless of an audio jack plugged in or not.). With all devices listed now (hopefully), you can right-click on those devices that Windows (10) has stupidly disabled. Another pop-up menu appears. Click on menu item 'Enable', to enable the device again.
For example, the USB audio codec in an IC-7300 appeared as "Mikrofon (USB Audio CODEC)" there.

( losely based on www.sdr-kits.net/documents/VNWA_Sound_Devices_error_after_Windows10_upgrade.pdf, thanks Jan ! )

See also (older, but related subjects) :
    Windows 10 camera, microphone, and privacy,
    Stop windows from hiding audio devices which are not 'plugged in' (even Windows 7 had this bad habit).


8.2 Even more "fun" with Windows 10 : No more audio from the soundcard due to 'Privacy Settings'

Out of the blue (after yet another Windows 10 security update, possibly "1803"), all audio inputs from soundcards and similar devices (including audio codes in SDRs like IC-7300, IC-9700 and many others) failed. Like many other soundcards, Spectrum Lab was unable to open such devices for input anymore. The following error message appeared in SL's error history (and, if it was allowed to automatically pop up the error history display, showed this immediately after launch):
   Device ID Out of Range in SoundInOpen
Reason: Since Microsoft still think anything with an analog-to-digital converter in an audio device must be a "Microphone", so their new 'Privacy Settings' switched off the use of audio inputs on your computer.

Cure: Change the Privacy Settings as follows:
  Start Button .. Settings .. search for Privacy; Microphones
There's a screen showing 'Microphone' / 'Let apps use my microphone', with the usual slide switch. Turn it on for all applications, or (if you don't trust some of the software installed on your PC) try to specifically allow those programs you trust to use the 'microphone'.

( based on www.sdr-kits.net/documents/VNWA_Windows_10_Privacy_settings.pdf, thanks Jan ! )


9. Buglist (moved to the SL User's group)

As of 2018, an up-to-date list of bug reports, and possible fixes, was at the Spectrum Lab User's Group (currently at groups.io).

top of page


Last modified : 2023-10-20

Benötigen Sie eine deutsche Übersetzung ? Vielleicht hilft dieser Übersetzer - auch wenn das Resultat z.T. recht "drollig" ausfällt !
Avez-vous besoin d'une traduction en français ? Peut-être que ce traducteur vous aidera !