Space weather alert
Space weather impacts radio communication in a number of ways. Changes in ionospheric density and structure modify the transmission path and even block transmission of HF radio signals completely. In a typical sequence of space weather storms,
the first impacts are felt during the solar flare itself. The solar x-rays from the sun penetrate to the bottom of the ionosphere (to around 80 km). There the x-ray photons ionize the atmosphere and create an enhancement of the D layer of the ionosphere.
This enhanced D-layer acts both as a reflector of radio waves at some frequencies and an absorber of waves at other frequencies. The Radio Blackout associated with solar flares occurs on the dayside region of Earth and is most intense when the sun is directly overhead.
The protons are guided by Earth's magnetic field such that they collide with the upper atmosphere near the north and south poles. The fast-moving protons have an affect similar to the x-ray photons and create an enhanced D-Layer thus blocking HF radio communication at high latitudes.
During auroral displays, the precipitating electrons can enhance other layers of the ionosphere and have similar disrupting and blocking effects on radio communication. This occurs mostly on the night side of the polar regions of Earth where the aurora is most intense and most frequent.
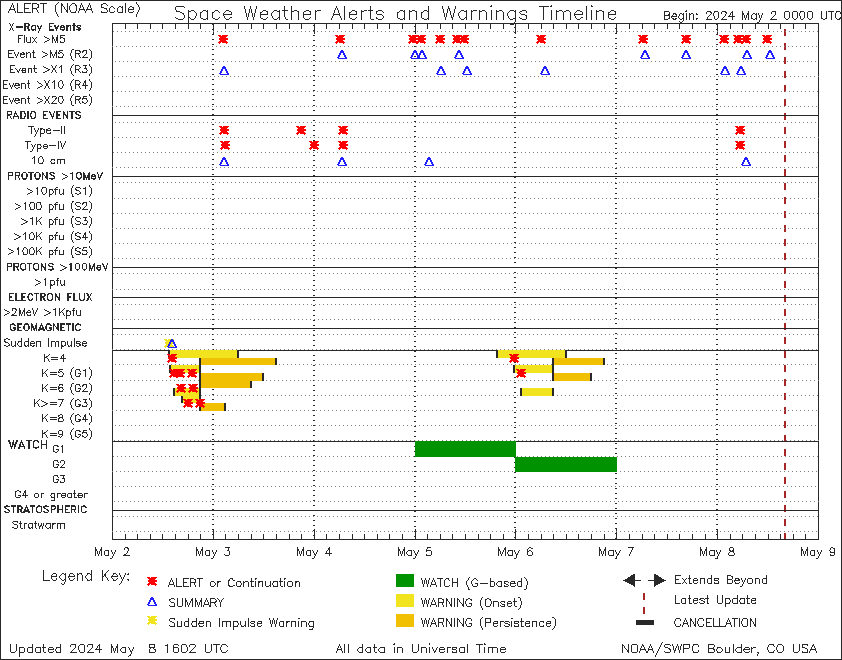
Space weather overview
These plots provide a quick look at some of the most frequently examined space weather indices.
- Solar X-ray flux
- Solar proton flux
- Geomagnetic activity
- Ionizing radiation that arrives at earth immediatly;
- A supersonic shockwave riding along the solar wind;
- Dense particles behind the shockwave that arrives two to three days after the flare.
Ranges from R1 (weak or minor degradation of HF radio communication on sunlit side, occasional loss of radio contact) to R5 (Complete HF (high frequency) radio blackout on the entire sunlit side of the Earth lasting for a number of hours)
Ranges from S1 (minor impacts on HF (high frequency) radio in the polar regions) to S5 (Complete blackout of HF communications possible through the polar regions)
Ranges from G1 (Minor HF propagation impact at higher latitudes and aurora is commonly visible at high latitudes) to G5 (HF (radio propagation may be impossible in many areas for one to two days)
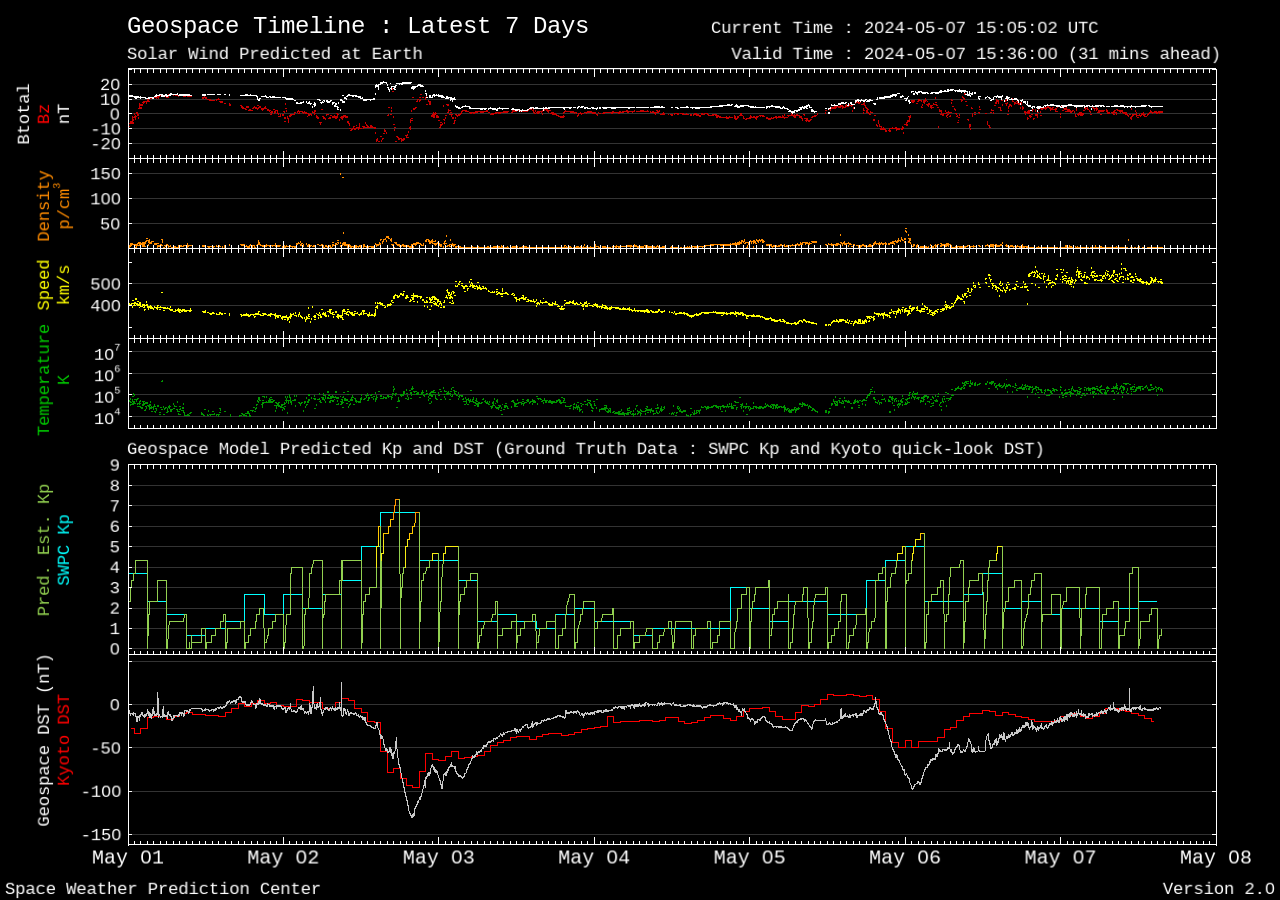
Geospace timeline
Solar wind has a negative effect on HF radio propagation (above 10 MHz) by severely interfering with the Earth's ionosphere. HF radio signals become absorbed rather than reflected in the highly ionised ionosphere, resulting in fading and even total loss of signal at the receiver
These plots provide a quick look at solar wind data and Geospace model
Average values for solar wind velocity, density, and magnetic field strength at the orbit of the Earth are 468 km per second; density, 8.7 protons per cubic centimeter, and 6.6 nT, respectively.
Average values for solar wind velocity, density, and magnetic field strength at the orbit of the Earth are 468 km per second; density, 8.7 protons per cubic centimeter, and 6.6 nT, respectively.
For a geomagnetic storm to develop it is vital that the direction of the interplanetary magnetic field (Bz) turns southward. Continues values of -10nT and lower are good indicators that a geomagnetic storm could develop but the lower this value goes the better it is for auroral activity. The Btotal value of the interplanetary magnetic field indicates the total strength of the interplanetary magnetic field. The units are in nano-Tesla (nT)
The Dst index is used to gauge storm intensity and to represent storm time space-weather phenomena. A weak storm has -30 nT > Dst > -50 nT, a moderate storm has -50 nT > Dst > -100 nT, a strong storm has -100 nT > Dst > -200 nT, a severe storm has -200 nT > Dst > -350 nT, and a great storm has Dst < 350 nT.
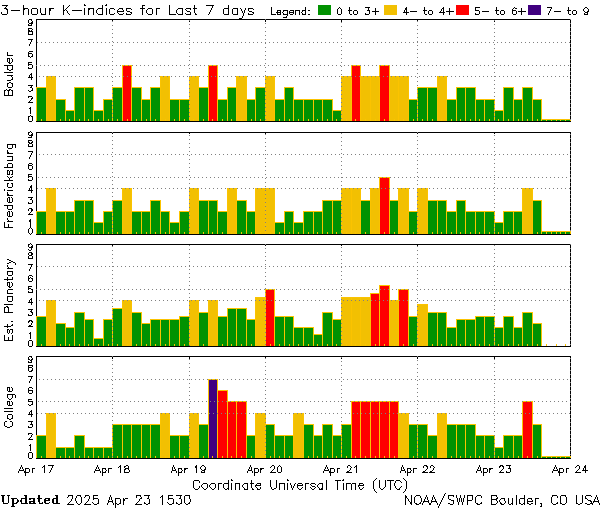
Real time k-index
The K index showing the geomagnetic conditions, indicates HF noise primarily below 10 MHz.
(K=1; HF Noise= S1-S2), (K=3; HF Noise= S2-S3), (K=5; HF Noise= S4-S6), (K=7; HF Noise= S9+), (K=9; HF Noise= Black-out)
(K=1; HF Noise= S1-S2), (K=3; HF Noise= S2-S3), (K=5; HF Noise= S4-S6), (K=7; HF Noise= S9+), (K=9; HF Noise= Black-out)
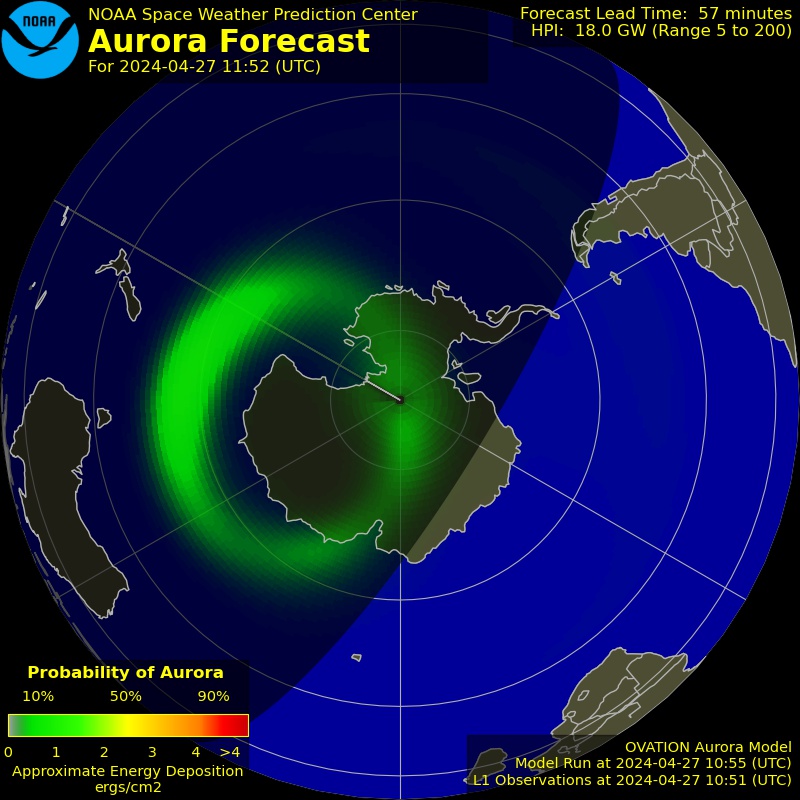
Auroral activity
When a solar wind blow reaches the Earth, it creates additional ionization in the areas around the magnetic poles.
The radio propagation paths that cross the poles may be degraded because of increased absorption of the radio signal. The auroral activity index ranges from 0 to 100%.

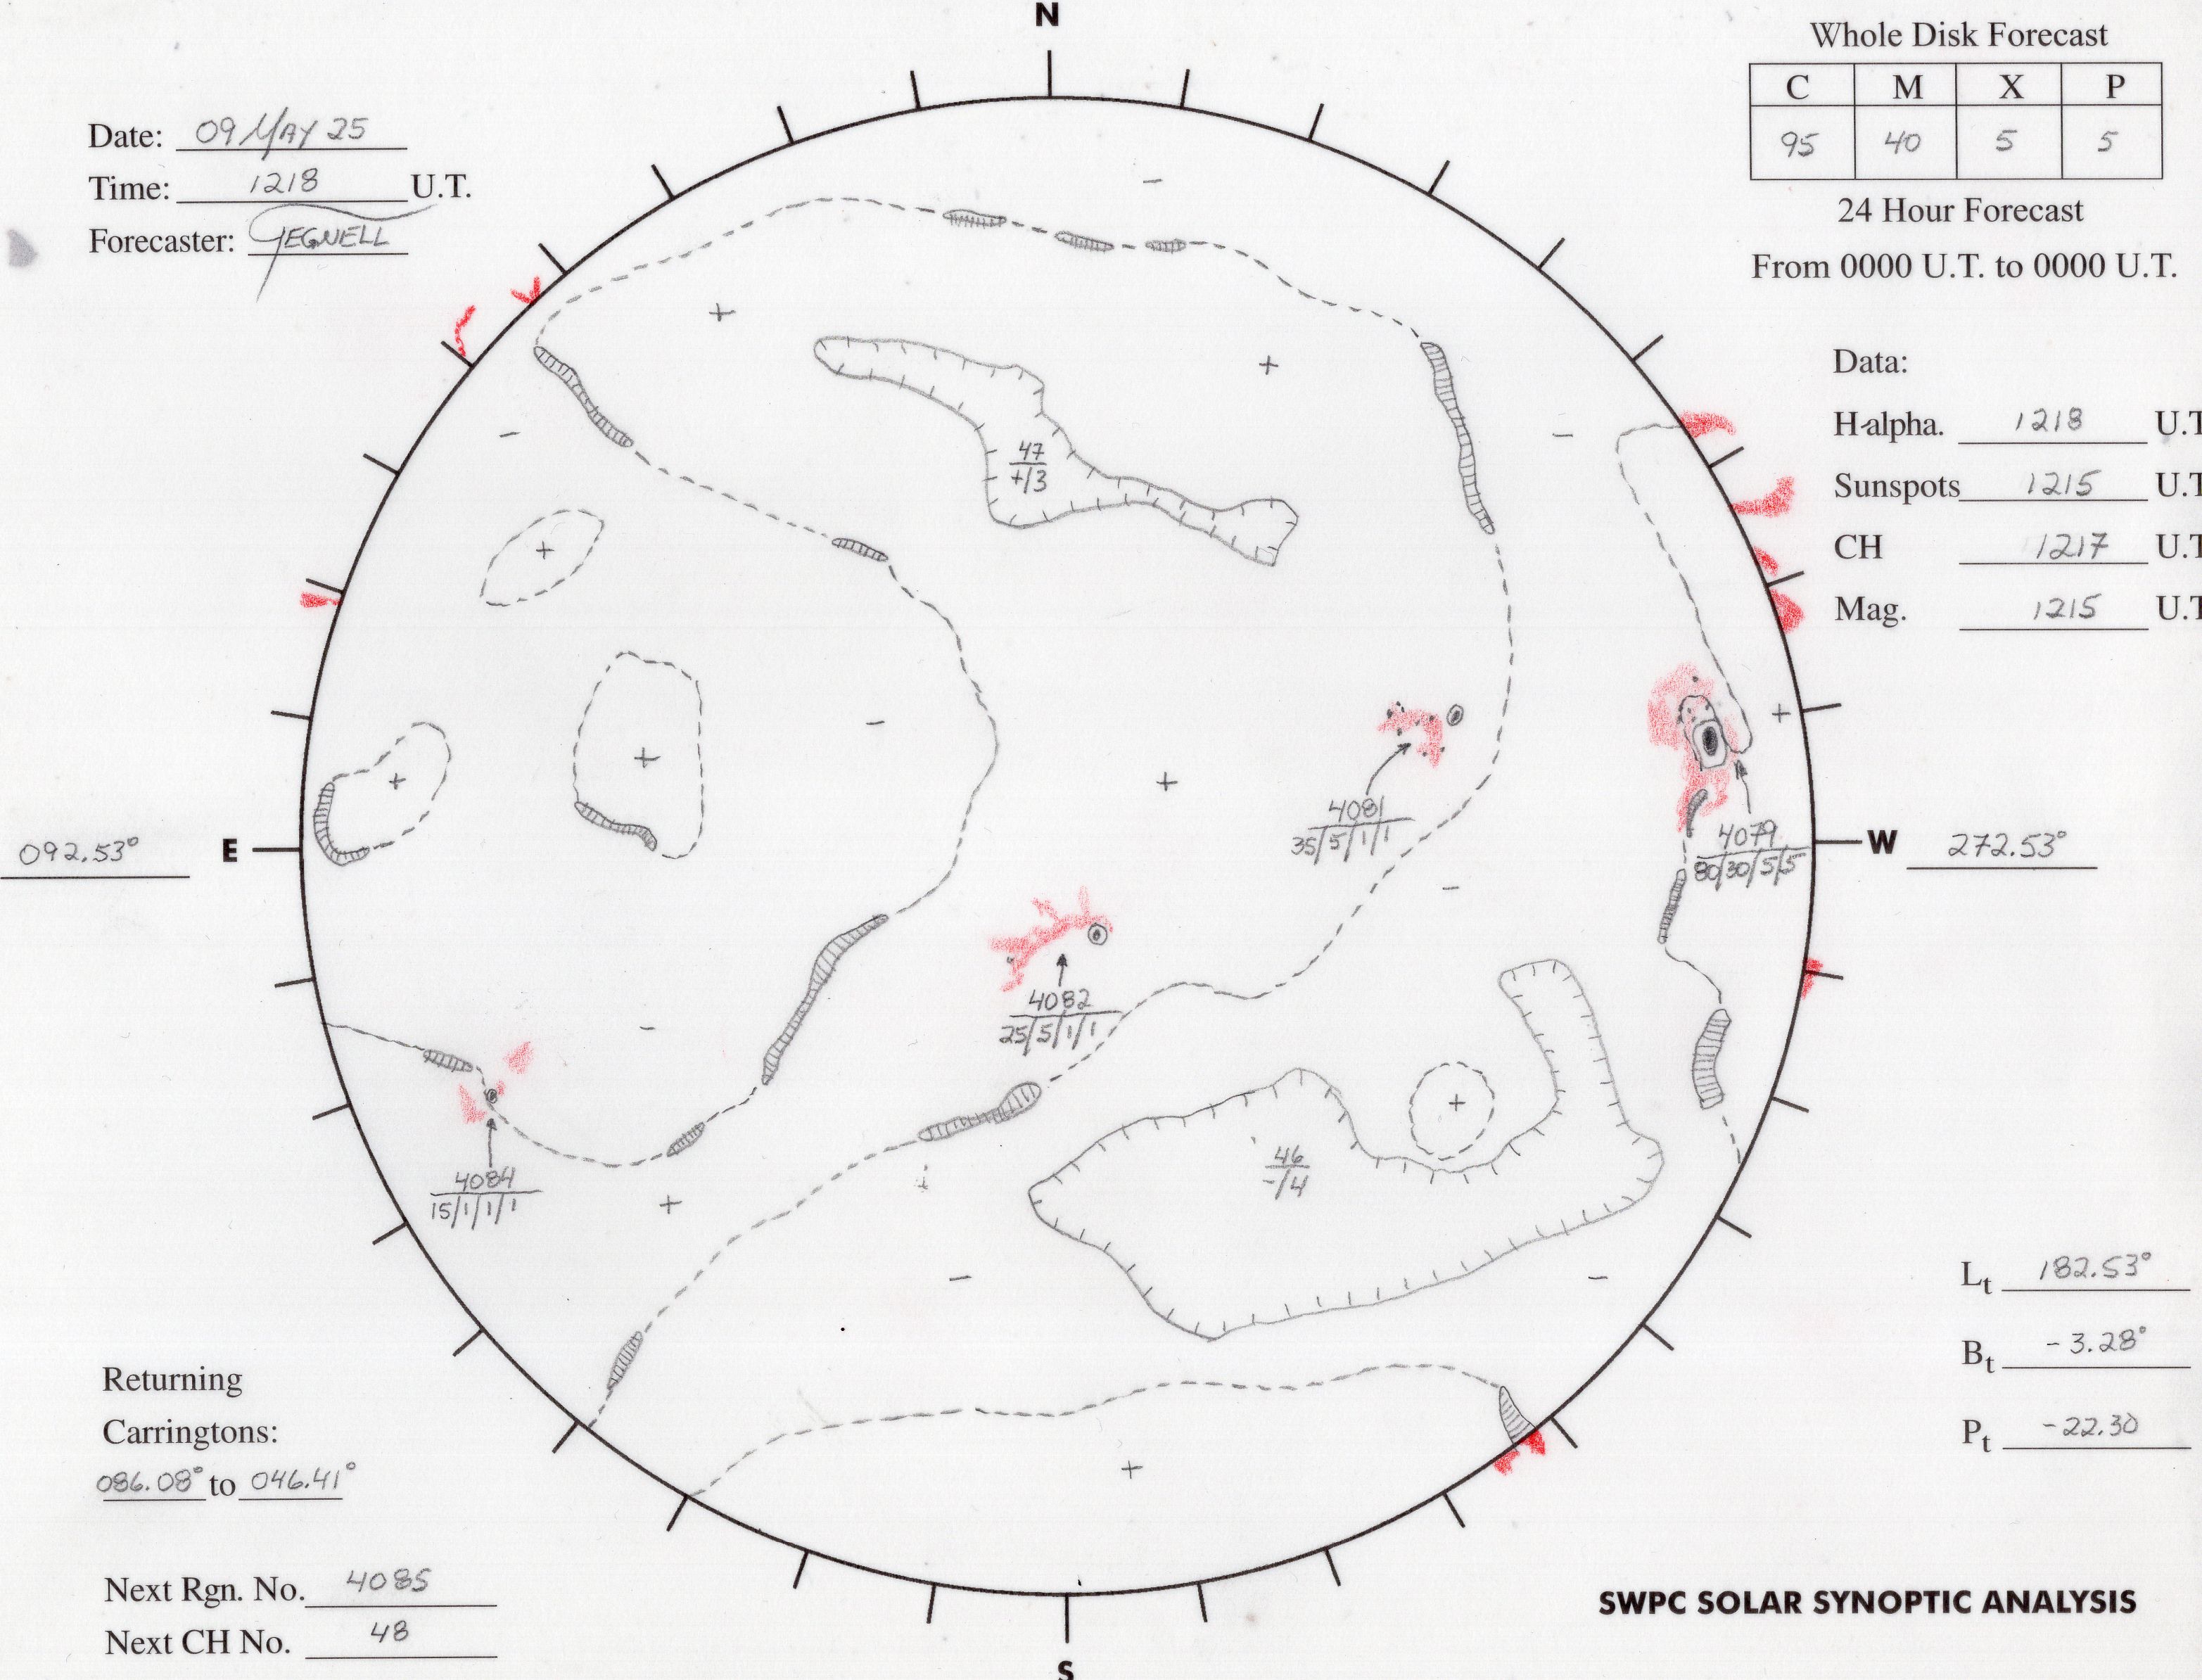
Sunspots
Sunspots are cooler areas on the solar surface. These active regions should be carefully watched for possible flare activity. A solar flare releases energy than can affect HF propagation:
Active regions are localized magnetic fields on the Sun. Areas with strong or intense magnetic fields provide energy for solar flares and coronal mass ejections (CMEs), so accurate forecasting of space weather activity requires an accurate picture of these regions. Active regions are given official numbers by SWPC, and the drawings include the probabilities of C, M, and X class flares for the next 24 hours associated with each active region, along with a proton event probability.
Coronal holes are single polarity magnetic regions that are the source of high speed solar winds which drive magnetospheric activity. Coronal holes are the most common cause of geomagnetic storms. Coronal holes have historically been identified from He I 10830A ground-based observations. The boundaries of coronal holes are shown on the synoptic drawings as lines with hash marks on the coronal hole side of the boundary line.
Large magnetic field structures of one magnetic polarity have a 'neutral line' at the boundary of the different magnetic polarities of the fields. Neutral lines are associated with flaring in active regions, and filaments/prominences are often associated with the neutral lines on a quiet sun. Neutral lines appear as dashed lines on the synoptic drawings and the forecaster indicates the polarity of the magnetic field on either side of the neutral line with + (positive) and - (negative) signs.
Plages make up most of an Active Region, and appear bright in conjunction with the dark sunspots. Plages have strong magnetic fields but disorganized magnetic fields, unlike the highly organized fields of sunspots. In the synoptic drawings, plages are colored red. It is quite normal to have regions of plage with no sunspots, which do not receive an official number since they are not considered active regions and are unlikely to produce solar flares. Plage regions are the chief source of UV variability from the sun, however.
Highly-stable regions of high density gas in the low density corona are called filaments. When these occur near the limb and can be seen protruding from the corona, often in spectacular fashion, they are called prominences. When they erupt they can be a geomagnetic storm threat, but the eruptions are usually slow and don't often drive large storms. The filaments and prominences are drawn as outlines with hash marks.
Short historical graph of WWV numbers
The solar flux, indicating the level of ionization, affects HF propagation above 10 MHz. The solar flux does not affect 7 MHz and below, since the MUF seldom drops below 10 MHz.
The higher the inonization the more reflective our ionosphere is to HF signals, and the higher the MUF.
Sunspots are cooler areas on the solar surface. These active regions should be carefully watched for possible flare activity.
A index, is derived by averaging the K-index. It ranges from 0-20 for quiet conditions, up to 400 for extreme conditions, representing the overall planetary geomagnetic conditions.

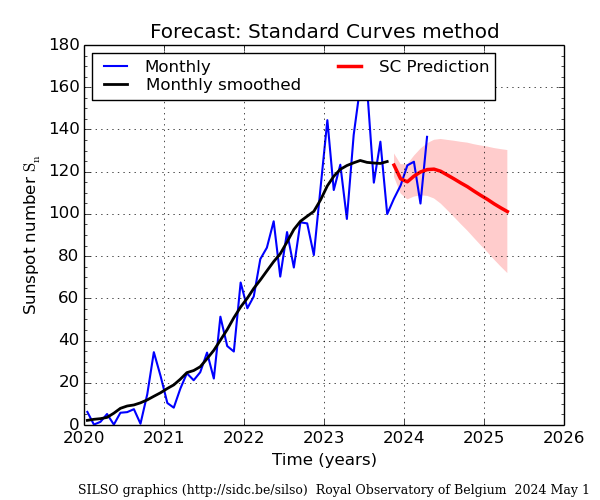
12 month ahead Cycle Prediction
Forecasts of the monthly mean sunspot number using the Standard Curve method (extension of the original method by M.Waldmeier). The method consists in the least-square fit and interpolation of a set of standard curves, each curve corresponding to the average shape of solar cycles of a narrow range of maximum value.
The fit is done on the observed 13-month smoothed monthly sunspot number, using the last 24 available values. This is why the prediction actually starts 5 months before the last elapsed month and runs over 18 months (up to 12 months ahead).
This method performs well in the middle of each cycle, but as all methods based purely on past solar activity, it becomes unreliable at the end of each cycle and during the minima.
CT1BOH - José Carlos Cardoso Nunes - [email protected]