Characteristics of a Universal Wideband Amp
This is from a circuit I built in
December 2008. The circuit is one of many kits offered by Diz,
W8DIZ at www.kitsandparts.com.
This kit is part of what Diz calls RF Tool Kits, Electronic Building Blocks. He has a number of these kits and more come out every so often. I like to look at what he has to offer and build some of them homebrew style from the data he has on-line. I also buy many kits from him which keeps him coming out with new items and ideas all the time. He also has a large inventory of "roids" (toroids) as well as parts and odds-and-ends. His banner on the web page says it much better... Supplying Toroids, Electronic Parts and Kits to Engineers, Schools and Hobbyists.
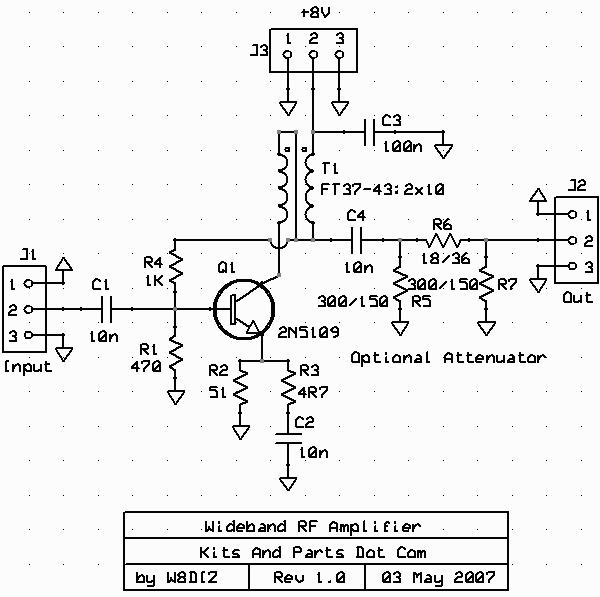
OK, here is the schematic of the Universal Wideband Amplifier (UWA):
This kit is part of what Diz calls RF Tool Kits, Electronic Building Blocks. He has a number of these kits and more come out every so often. I like to look at what he has to offer and build some of them homebrew style from the data he has on-line. I also buy many kits from him which keeps him coming out with new items and ideas all the time. He also has a large inventory of "roids" (toroids) as well as parts and odds-and-ends. His banner on the web page says it much better... Supplying Toroids, Electronic Parts and Kits to Engineers, Schools and Hobbyists.
OK, here is the schematic of the Universal Wideband Amplifier (UWA):
 |
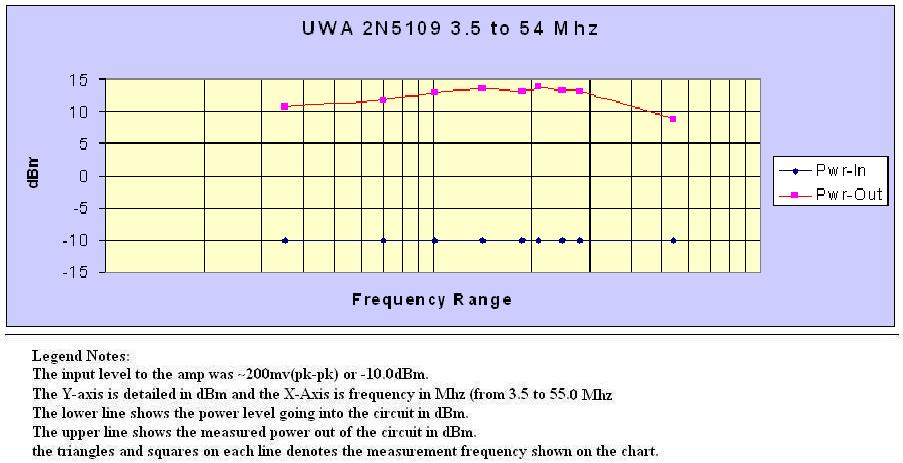
The amp is straight forward and simple, yet remarkable. Diz boasts it has a7x voltage gain or about 17 dBm power gain measured at 10 MHz with 50 ohms I/O and powered with 8 volts DC. It is that and a tad more. The concept of Vcc being 8v-dc is a very practical approach if one were to use this circuit in a minimal rig that includes a NE602/612 and LM386 chips. I found that raising the Vcc voltage up to 12 volts did not yield any appreciable gain. The amp circuit's output is consistent when used for 3.5 to 30 Mhz, providing about a 22 to 23 dBm increase over its input signal level. I looked at the output level for 6 meters and it was slightly down from the 3 to 30 Mhz range. I have graphed a chart (see below) that shows the power increase of the circuit. Also shown is the raw data from my measurements. I used a Singer CSM-1 for my signal source, a Tek 2465 o-scope for verifying input signal levels (~200mv pk-pk), the M3 Power/Frequency meter, and a 0 to 90 dBm attenuator to pad the input to my W7ZOI Spectrum Analyzer. |
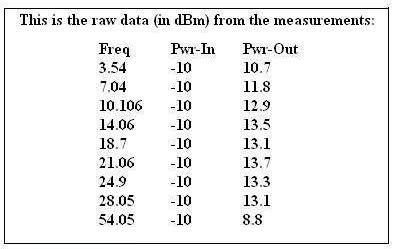
The drawings below show the difference of input to
output, raw data and
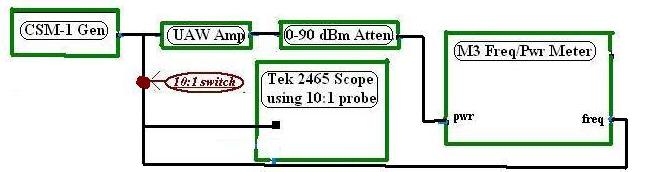
test equipment set-up
 |
 |
|
Test equipment
used for this set-up consisted of:
Singer CSM-1 Communications Monitor that has a fantastic signal generator built-in (sig gen). Tek 2465 o-scope with a switchable 10:1/1:1 probe. M3 Frequency and Power Meter (M3 meter). Weinschel Eng. 0 to 90 dBm Attenuator. W7ZOI homebrewed Spectrum Analyzer (SA) The procedure for measuring the dBm increase between the in- and output of the amp circuit is repetitive in nature for each frequency. The output of the amp circuit did not have the optional attenuator resistors installed. I did install a 51 OHM resistor across the output for termination purposes and it helped shape the output waveform. I tried using a 51 OHM resistor across the input, but this seemed to load down the sig gen and skewed the output measurement by two to three dBm. I chose the CW portion of each band as that is where my interest normally lies with homebrew projects. I would measure the output of the sig gen using the o-scope, setting it as close to 200mv_pk-pk as possible, and verify using the M3 meter. I found that I had to switch the scope probe from 10:1 to 1:1 to obtain enough signal level to get an accurate reading on the M3 meter to lock in the measurement frequency for the power measurement...this is unique to the M3 meter, but the extra effort is paid off with a very accurate and stable power measurement. I Tee'd off the scope probe cable to the M3 meter so I did not have to change cables around between each frequency change. Once the frequency and input level were set, I would measure the output using the M3 meter and verify with my SA. I used the variable attenuator to set up the SA so I could readout the power level reading without having to change scales to offset the -30 dBm input level requirement on the SA. I would select the freq on the CSM-1 (sig gen) and set-up the signal level for 200mv pk-pk. Then I lock the frequency in on the M3 meter by switching the scope probe to 1:1. Once the frequency was locked in, I changed the probe back to 10:1 so as not to skew the power measurement. I could move the probe from input to output on the amp circuit if I wanted to view the waveform...I could have just used two probes, but there were enough cables scattered around as it was! I would switch the M3 meter measurement mode from frequency to power and record the reading. I also watched the SA to verify this recorded data. I can read to less than 2 dBm on the SA, so any radical signal level setting would be easily noticed. Once done, I would then set-up for the next frequency. I may go back sometime in the future and redo my measurements for a range of 1 to 60 Mhz in either 2 or 1 Mhz increments. That series of measurements will take some time and I other projects I would like tobefore the end of this year (2008). If I do get the additional data points accomplished, I will mention it on the Station Log web page. |