From: abe riazi ([email protected])
Date: Fri Sep 15 2000 - 19:17:29 PDT
Dear Scholars:
While visiting a Barnes & Noble bookstore in San Jose, I purchased a copy of the "Spice Practical Device Modeling" , by Ron Kielkowski.
What especially appealed to me about this publication was its high emphasis on model creation. In this book SPICE models are classified according to a hierarchy which includes:
1. Transistor-level models ( provide highest accuracy, though most time consuming to simulate).
2. Macromodels.
3. Behavioral Macromodels (fastest to simulate, but least accurate)
Most attention is devoted to Macromodels, because they offer a practical level of accuracy (less than 5% rms error over operating range) and can be created in a reasonable amount of time (less than eight hours).
The procedure recommended by Ron Kielkowski for construction of macromodels consists of the following steps:
i. Review the datasheet to obtain as much information related to model creation as possible (although, frequently majority of the information given in the datasheet has little value towards model generation).
ii. Utilize bench-top measurement equipment to produce I-V, C-V and Z-F curves.
iii. From above data extract the desired model parameters.
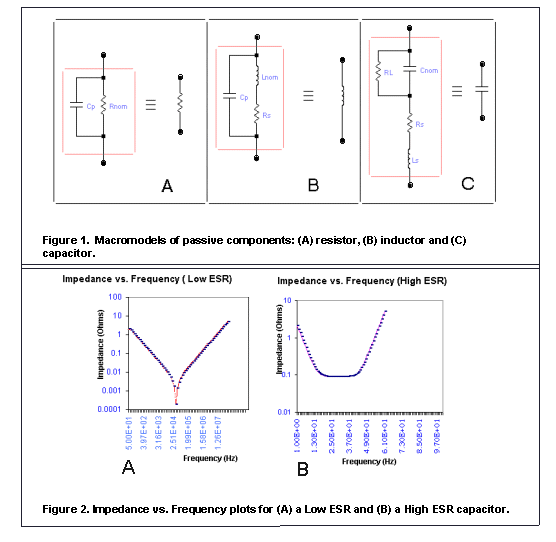
For a resistor, the Macromodel elements consist of a nominal resistance Rnom and a parallel capacitance Cp; for an inductor, Lnom (nominal inductance), Rs (coil resistance) and Cp (winding capacitance); and for a capacitor, Cnom (an ideal capacitor), RL (leakage resistor), Ls (series inductor) and ESR (electrical series resistance). These macromodels are illustrated by Figure 1 (attached gif picture).
In this publication (reference 1), the significance of impedance vs. frequency plots is emphasized, because:
a. Regarding macromodel of a resistor, the |Z| vs. F graphs aid to ascertain Cp.
b. For inductor Macromodels, they allow determination of the series resistance frequency (Frs) and self resonating frequency (Fsrf) from which values of Lnom and Cp can be calculated via simple formulas.
c. Considering capacitor macromodel, several parameters can be extracted from the impedance vs. frequency curves, such as ESR (RS) , lead inductance Ls (calculating Ls involves Fsrf which can be obtained from graph) and Cnom (the nominal capacitance can be also measured by means of a low frequency capacitance meter).
ESR and |Z| vs. F plots have been explained previously in this forum in relation to PCB power distribution systems, decoupling and bypass capacitors. They are also included here due to their significance towards macromodel generation.
Figure 2 presents two examples of impedance vs. frequency graphs. Such plots can be created in a number of different ways; here, Microsoft Excel was employed. In each case the raw data consisted of three columns: current ( I ) , Voltage drop ( V ) and frequency ( F ). The Excel program calculated another data column (impedance Z = V/I ), and produced the logarithmic impedance plots. Clearly, ESR strongly influences the shape of |Z| vs. F curves.
Macromodels can be incorporated into SPICE simulation files as subcircuits; demonstrated by the example below:
Example 1. Encapsulation of a capacitor macormodel CMACRO, having parameters Cnom, RL, Ls and Rs (ESR).
In the circuit input file example.cir:
X_MACRO 2 0 CMACRO
.INCLUDE EXAMPLE.MOD
In the model file example.mod:
.SUBCKT CMACRO 10 20
Cnom 10 30 1000uF
Rs 30 40 0.15ohms
Ls 40 20 5nH
RL 10 30 10meg
.ENDS CMACRO
Use of macromodels instead of SPICE primitive models can significantly enhance the accuracy of a high frequency simulation and yield results in excellent agreement with physical measurements.
Simulation of certain cases (such as high power circuits) require taking into consideration effects due to temperature variations. Temperature dependent macromodels can be readily constructed (reference 1).
To summarize, Macromodels assume an intermediate position in the hierarchy of SPICE models in the sense that they are below the transistor-level models in accuracy and rank second to behavioral models in simulation speed. They are in demand by being practical; i.e., can be created in a reasonable amount of time with an error margin tolerable in many applications. Impedance vs. frequency plots play a critical role in creation of macromodels of passive components. These models can be inserted into SPICE input files as subcircuits. Simulations utilizing macromodels yield superior results than using ideal SPICE primitives, particularly in the high frequency domain.
Reference 1. R. M. Kielkowski, "SPICE Practical Device Modeling", McGraw-Hill, Inc. 1995.
Thanks for your comments and with best regards,
Abe Riazi
ServerWorks
2251 Lawson Lane
Santa Clara, CA 95054

**** To unsubscribe from si-list or si-list-digest: send e-mail to
[email protected]. In the BODY of message put: UNSUBSCRIBE
si-list or UNSUBSCRIBE si-list-digest, for more help, put HELP.
si-list archives are accessible at http://www.qsl.net/wb6tpu
****
This archive was generated by hypermail 2b29 : Tue May 08 2001 - 14:29:30 PDT