This page contains a disorganized collection of interesting information pertaining to the Kenwood TS-870S Transciever.
Auto Notch and Beat Cancel Usage
The auto-notch is in the IF, and should only be used when the
interfereing tone is
stronger than the signals you are trying to hear. In this case
- it is VERY effective
because it prevents the AGC from turning the gain down and attenuating
the signals you
want to hear.
The beat-cancel is in the AF (audio) section. It is useful
for eliminating tones when the
interfereing signal is at or below the signal strength of the
signals you want to hear.
For EACH of these filters: once turned on, the rig searches
for a predominant tone to
filter out. This is called auto-tracking. However, when there
is no interfereing tone, the
auto-tracking hunts around for one, creating the distortion that
you are hearing.
One way to get around this is to only use these filters when
the tone is present (i.e.
don't leave it on all the time). If the tone is intermittent (like
someone tuning up, or
some lid, etc.), you can temporarily stop the auto-track feature.
Menu 18 is the
auto-track, just turn it off. When off, it stays on the last tone
found.
I keep menu-18 on the quick-menu feature. When I get a persistent
tuner or lid making
a tone, I push the appropriate filter based on the interference
strength, then turn off
the auto-track. When the auto-track is off, the audio distortion
from leaving the
auto-notch or beat-cancel on is very small (because it isn't hunting
for tone).
If you use these filters as they're intended, and apply the
auto-track on/off - you'll be
very happy with the results.
S-Meter Readings
I made a couple of measurements on my TS-870S to see how the
S-meter reponds. This was done on 20m, USB (AIP off, i.e. no AIP
indicator), no attenuation. I used a RF signal generator and a
step
attenuator with 1dB resolution. I started out by adjusting the
signal
generator output to give S9 reading with the attenuator set to
0dB.
Then, I recorded the attenuation level required to light-up /
turn-off
each segment of the meter. Here are the results. The Segments
column is the
number of segments illuminated, and dB is the attenuation level,
and last
is the S-meter level:
| Segments |
|
|
|
|
|
|
|
|
|
|
|
|
|
|
|
|
|
|
|
|
|
|
|
|
|
|
|
|
|
|
|
|
|
|
|
|
|
|
|
|
|
|
|
|
|
|
|
|
|
|
|
|
|
|
|
|
|
|
|
|
|
What you can see from these measurements is that the S-meter
is NOT
linear in dB over this range. It is close to 6dB / S-unit at the
S9 end
of the meter, and 1-2dB per S-unit at the S1 end of the scale.
At the
top end of the scale, it is about 4dB/segment. This holds fairly
constant above S9 also, since there is about 5 segments per 20dB
above
S9, and some additional measurements that I made basically confirmed
that the "red" end of the meter is pretty close to being
accurate (20dB
change indicated is basically equal to a real 20dB change). Since
there
are 15 red segments from S9 to S9+60dB, this means that it is
pretty
close to 4dB per segment in this range.
SSB Frequency Response
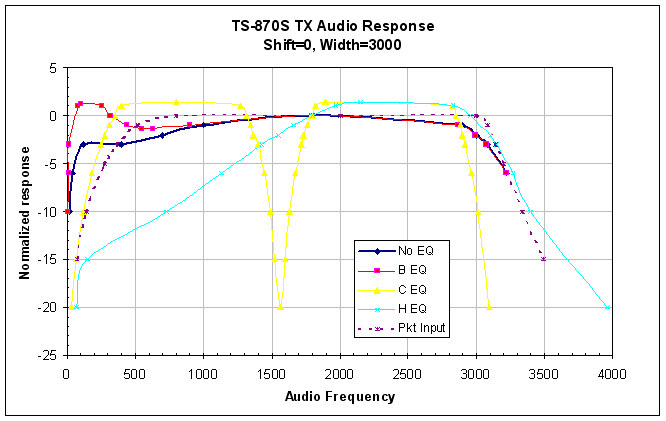
Frequency response of transmitter in SSB mode. Curves measured
by K2OX, and normalized to 1800Hz.
