Below are plots of field measured
data. The SWR is measured at the rig. The F/B readings are
derived from field strength measurements taken with a IC-756 PROII rig
located about 1 Km from the tower. S-meter readings were recorded
every 5 kHz as shown, while 10w transmit power was applied to the yagi.
Two "sweeps" were recorded: one with the yagi pointed forward,
and one from the back of the beam. The difference between these is
the "Front/Back S-meter" value. These values were
converted to dB using 5 dB/S-unit. (This value was determined by
doing "a power test"...the transmit power was increased by 5 w increments
and the S meter reading were recorded...this was then converted to
dB/s-unit)
Because of the inaccuracy of the S-meter readings and the dB/s-unit conversion, these F/B values are not accurate, but the following plots do provide confidence regarding the optimum "relative" tuning of the Yagi. |
![]() |
This plot shows the optimized tuning in the
SSB portion of the band. Two sets of curves are shown...one with and one
without the "fine tuning" (.7uH) inductor. The tuning is very close to
ideal with max. F/B coincident with minimum SWR.
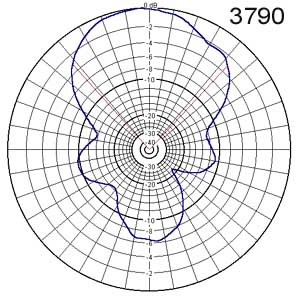
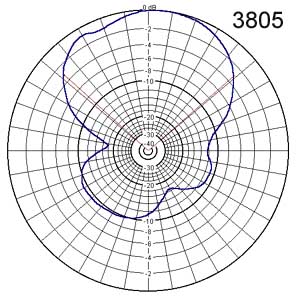
Notice that the yagi reverses direction (below 0 dB F/B) about 20 kHz below the peak F/B. The SWR curve is very steep at the lower end of each range. This is consistent with the modeling results. 2:1 bandwidth : 38 kHz (3805-3777) |
![]() |
The same plot for the CW portion of the
band. The bandwidth is more broad than the SSB plot. This may be
because of the larger 9 uH loading coil, or because the tuning is not yet optimized
in this example.
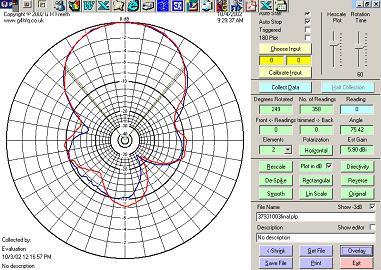
The plot shows that tuning is not correct since the minimum SWR is about 20 kHz below the maximum F/B. The CW inductor on the driven element will be adjusted to move the minimum SWR point up. (the coil will be stretched out slightly) see below. |
![]() |
Driven element CW inductor readjusted.
SWR and maximum F/B now closer.
2:1 SWR Bandwidth: 40 kHz (3500-3540) |
Field measured Azimuth Plots At left is the first Polar Plot recorded in the near field of the Yagi. The source was the IC-756PROII located about 800m from the yagi transmitting about 5 W. RED: 3793 kHz BLUE: 3800 kHz This pattern does not show the expected ideal F/B and has an unusual asymmetry in the rearward lobe. This could be a near field "arrival angle" effect or local scattering. Further test will be conducted with more distant "local" sources as well as some sky-wave sources which may show different results. (at left is a screen shot from the program Polar Plot by G4HFQ)
|
|
The following "near field" measured plots show how the pattern varies with frequency. (recorded with a 5w source located 800m from yagi) These plots show that the Yagi as tested here is tuned for max. F/B at 3805....not the expected 3795. |
![]() |
![]() |
![]() |
![]() |
![]() |
![]() |
![]() |