|
|
|
INTRODUCTION
A deviation monitor can be made by connecting some form of frequency modulation (FM) detector to an AC voltmeter and calibrating the meter in units of frequency deviation. One method of detecting or demodulating the FM signal is to use a phase locked loop (PLL). A voltage controlled oscillator (VCO) is locked to the FM signal frequency by comparing its output with the FM signal in a phase comparator which generates a correction voltage to control the frequency of the VCO. This voltage is a function of the signal frequency and hence is a demodulated version of the signal frequency.
Conventional FM demodulators, such as the frequency discriminator, require precise tuning, that is, they are fixed frequency devices. Tuning can only be achieved by varying the frequency of a heterodyne oscillator. The advantage of the PLL is that it can be used to detect FM signals, without retuning, over a frequency range equal to the capture range of the loop. When heterodyning for a different frequency range, only a fixed frequency heterodyne oscillator is required.
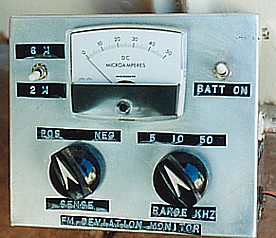
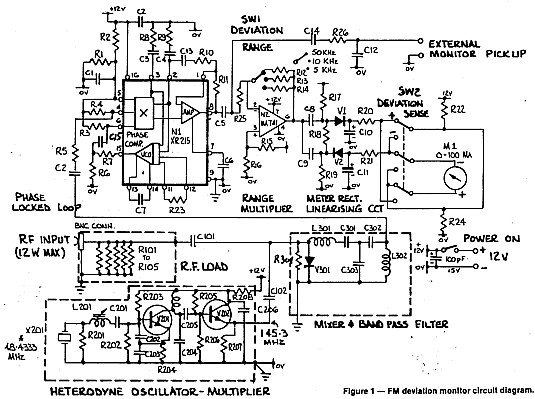
The following text describes a deviation monitor which has been constructed using a phase locked loop as an FM detector. Circuit detail is shown in Figure 1. The essential circuit blocks are a heterodyne oscillator, frequency mixer, phase locked loop and a metering circuit calibrated in frequency deviation. The heterodyne circuit is fixed for the 2 metre band but the monitor could be used on other bands with other appropriate heterodyne circuit design.
OPERATING FREQUENCY
The VCO in the phase locked loop is set for a free running frequency of 1 MHz. The approximate capture range is 500 kHz, hence the VCO will lock to any frequency in the range of 750 to 1250 kHz.
Equipped with the crystal specified, a frequency of 145.3 MHz is generated and this heterodynes with signals in the 146.05 MHz to 146.55 MHz region to provide a beat frequency for the PLL input within 750 to 1250 kHz. The spectrum 146.05 to 146.55 includes the input frequencies of popular repeaters (old channels 41 to 48) and simplex (old channels 49 to 51).
FM DETECTOR
Integrated circuit N1 (type XR215) and associated circuits operate as a phase locked loop and FM detector. The free running frequency of the VCO in N1 is set by the values of C7 and R23.
Demodulated FM output is amplified by an operational amplifier in N1 package and by N2 (uA741). The switched feedback network of N2 (SW1, R12, R13, R14) is also used to select the deviation range by changing the gain of N2 circuit. Deviation ranges of 0-5 kHz, 0-10 kHz and 0-50 kHz are provided.
THE METERING CIRCUIT
The audio output of N2 is rectified by either diode V1 or diode V2 to charge either C10 or Cl1 to the peak value of the audio waveform. Positive or negative peak is selected by switch SW2 to feed micro-ammeter M1 via either R20 or R21. In conjunction with these resistors, M1 forms a peak reading voltmeter calibrated in terms of frequency deviation.
Deviation sense switch SW2 is provided to check for difference readings between positive and negative peaks, indicating non linearity or peak clipping on the demodulated waveform.
There is always a problem with meter scale linearity when using semiconductor diodes as meter rectifiers at low voltage. The metering circuit has been devised so that the linear scale of the micro-ammeter can be used over its essential range. Gold bonded diodes (type 0A47) were selected because of their low forward voltage and these are forward biased by resistor network R17, R18, R19, R22 and R24 to the point where conduction just commences. A small residual reading is indicated on the meter but linearity is good above five percent of the scale.
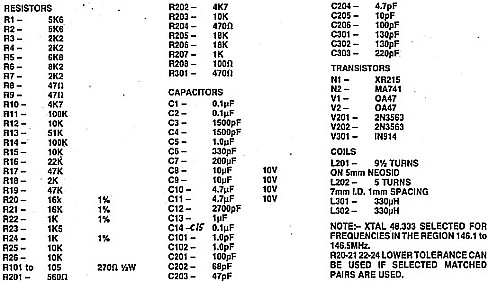
Resistors R17, R19, R22 and R24 are shown in the diagram as 1 percent but if these are not available, the important point is to select R17-R19 and R22-R24 as matched pairs.
A demodulated output is provided for external monitoring with a CRO or headphones. LP filter (R26-C12) restricts frequencies above the speech range.
RF CIRCUITS
The RF input circuit is arranged to load the transmitter to about 1W, terminated in 50 ohms. The power should not exceed 2.5W otherwise the ratings of resistors R101-105 will be exceeded. If transmitter power cannot be reduced, the transmitter must -be terminated in a suitable dummy load and the deviation monitor fed via an attenuation network.
The heterodyne signal is generated in the Circuit of V201, controlled by crystal X201 operating in an overtone mode at a frequency of 48.4333 MHz and tripled to 145.3 MHz in the same stage. (This circuit was used in the VK3ABP2 M converter- AR May 1982.) V202 is an isolation stage to prevent loading on V201 and provide low source impedence drive to the mixer.
The input signal and heterodyne signal are mixed by diode V301. A following bandpass filter removes the VHF components and provides a degree of rejection to beat components not in the 750 to 1250 kHz range.
At this point it must be pointed out that the VCO in the loop can lock on to frequencies harmonically related to frequencies within the capture range. This form of operation does not give the correct deviation readings, as calibrated, because the amount of deviation detected is multiplied or divided by the same harmonic relationship.
As the bandpass filter has finite slope, beat frequencies near the edges of the operating range are not rejected and these must be avoided. For example, a signal frequency of 145.9 MHz would heterodyne with 145.3 MHz to give a beat frequency of 600 kHz which might get through the filter and lock the VCO within its capture range of 1200 kHz. Under these conditions, deviation readings are erroneous and if such a frequency must be used, a different crystal is required.
COMPONENT ASSEMBLY
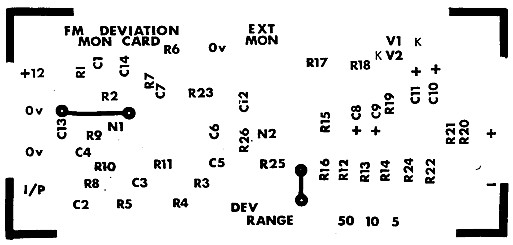
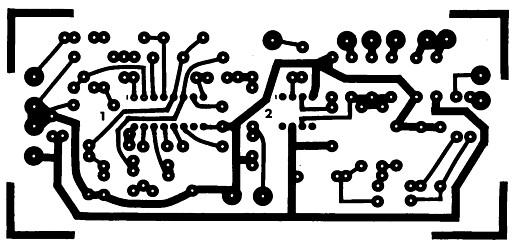
The complete unit has been assembled as an experimental prototype but a printed circuit board has been set out for the phase locked loop, amplifier and metering circuits (refer Figure 2). Components C13 and C14 were added after the board was prepared and these must be fitted in series with R10 and R26 respectively in the locations allocated to the latter components .
The RF load, heterodyne oscillator/ multiplier and bandpass filter were each fitted in separate shielded compartments as a precaution against circuit interaction. Each of these circuits were hard wired on Vero board, but wiring for the oscillator/multiplier must be kept short and a printed card would be a desirable improvement to ensure this.
TUNING AND TESTING
Initial testing should include the following:
(1) VC0 free running frequency - (check with a frequency counter or other frequency measuring device at pin 15 of N1). The frequency should be as close as possible to 1 MHz and, if necessary, can be adjusted by trimming the value of C7.
(2) Heterodyne oscillator - Check with the counter that the circuit is oscillating and tripling to 145.3 MHz by monitoring across R207. Peak the output level by adjustment of L210 and L202. If an instrument is not available to read signal level at 145 MHz, the measurement could be carried out using an RF signal at the input and measuring the beat signal at C2. L2 adjusts by expanding or compressing the winding.
CALIBRATION
Using the components specified, the unit should operate with reasonable accuracy, but variation in component values, within their tolerance, could be expected to provide some variation in accuracy. If precision is required, calibration should be carried out.
A number of methods could be used to calibrate the unit, depending on test instruments available. An RF source could be used either at 1 MHz fed to the PLL input (C2), or at VHF, fed to the unit input using a transmitter or VHF signal generator. Whatever the source, the signal must be frequency modulated with a constant tone and the amount of deviation established. Some signal generators are calibrated in frequency deviation. Calibration against another deviation meter could be carried out, if one is available.
The calibration method used by the writer makes use of the Bessel functions. Figure 3 illustrates the variation in the amplitude of the carrier and sideband components of an FM signal with variation in modulation index. (Modulation index is the ratio of frequency deviation to modulating frequency.) Note that the carrier passes through a null when the modulation index is 2.40, 5.52 and 8.65. This means, for example, that if a modulating frequency of 1000 Hz is used, the carrier will pass through a null when the frequency deviation is 2.4 kHz, 5.52 kHz and 8.65 kHz. A matrix can be drawn up using different modulating frequencies to produce nulls for various calibration points.

The best method to detect the nulls is to use a spectrum analyser which can display all the various modulation components in the frequency domain. Measurements can be carried out at the spectrum around 1 MHz monitored at C2. Another method is to use an AM receiver tuned to 1 MHz with the BFO turned on. The carrier frequency beat has to be picked out from the other sideband component beats and it does require some degree of imagination in selecting the right one.
Calibration can be adjusted by trimming the value of R25. Variation between ranges can be minimised by initially selecting resistors R12, R13 and R14 in the precise ratio of 1:5:10. If the null carrier method is used, it is easier to find the nulls if a large deviation is used on the top deviation range and to rely on the scaling of R12, A13 and R14 for the lower ranges.