
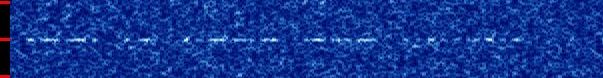
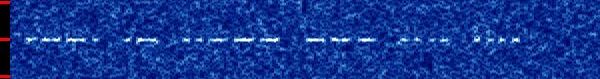
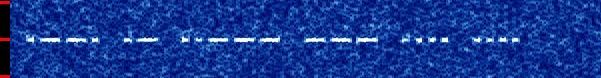
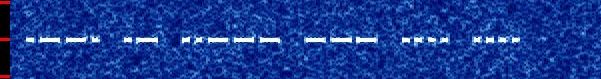
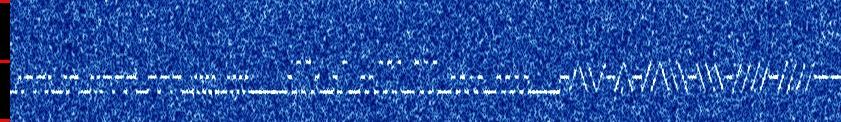
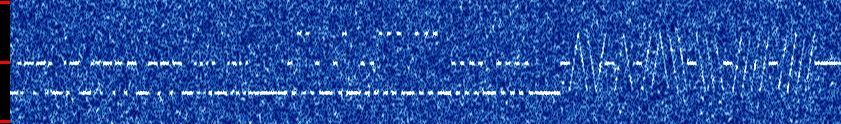
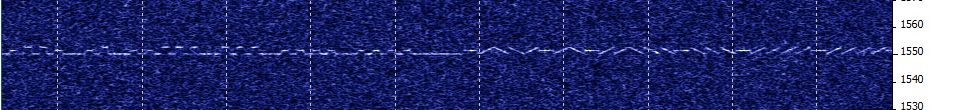
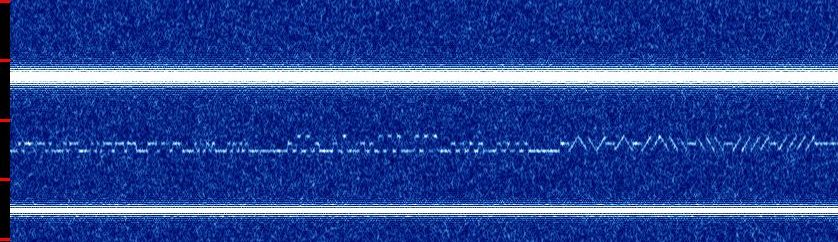
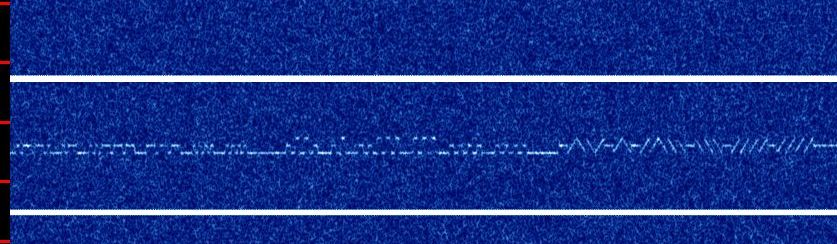
The modulation modes with the call PA2OHH. Left FSK2, middle FSK3, right CHIRP mode.
SIMULATION OF QRSS SIGNALS
(2012)
KLIK HIER VOOR DE NEDERLANDSE VERSIE
Simulation of QRSS signalsThe simulation program can be found at the following link: SIMULATION PROGRAM FOR QRSS SIGNALS
The configuration files given at the tests can be read into this program to make the WAV files. These configuration files can also be read with an ASCII tekst editor, so that you can see exactly which settings are applied for making the various WAV files. But the "conclusions" are just my personal remarks, it is not a serious scientific research!
Test modulation modes
The modulation modes with the call PA2OHH. Left FSK2, middle FSK3, right CHIRP mode.
FSK3
There are three shifts. All symbols do have the same length. The low shift is a pause, the middle shift is a dot and the high shift is a dash. The length of each symbol is 1.5x the dot length of FSK2. In this way, the FSK2 and FSK3 messages do have approximately the same length.
CHIRP
There are three different symbols. A dot is an upgoing line, a dash is a downgoing line. And a pause is a horizontal line. All symbols do have the same length. The length of each symbol is 3x the dot length of FSK2. In this way, the CHIRP message does have approximately the same length as the FSK2 and FSK3 messages. As the CHIRP mode does not have a pause between dot and dashes of one character!
SHIFT
The shift is lower than the usual 5 Hz. For FSK2, 1.25 Hz shift was taken. For FSK3 and CHIRP only 2.5 Hz instead of 5 Hz. With a lower shift, there do fit more QRSS signals in one frequency band, there are less co-interferences and the CHIRP mode performs better with a smaller shift.
Signal level (sensitivity)
At a constant noise level, a few levels of the QRSS signal were simulated. So we can see what the influence is of for example a doubling or halving of the transmit power (3 dB) or one S-point (6 dB).

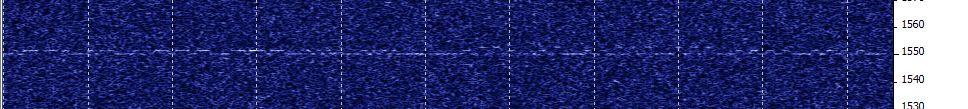
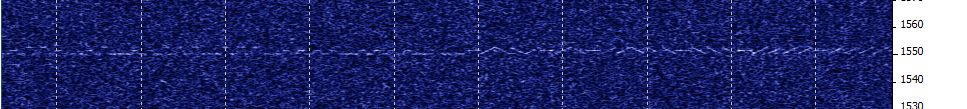
6 dB weaker (0.25x power, one S-point) than the 0 dB reference signal.

3 dB weaker (0.5x power) than the 0 dB reference signal.

The 0 dB reference QRSS signal with 2.5 Hz shift (1.25 Hz for FSK2).

3 dB stronger (2x power) than the 0 dB reference signal.

10 dB stronger (10x power) than the 0 dB reference signal.

20 dB stronger (100x power) than the 0 dB reference signal.
Configurations of the test signals (readable with a text editor)
12qrsssim1-reference-6db.cfg
12qrsssim1-reference-3db.cfg
12qrsssim1-reference0db.cfg
12qrsssim1-reference3db.cfg
12qrsssim1-reference10db.cfg
12qrsssim1-reference20db.cfg
Comparision with the human ear
This is a very interesting test! Everything in nature has been optimized. When our QRSS decoding software does perform just as good as the human ear, then we now that we cannot improve much anymore!
Audio file 10 dB higher (10x power) than the QRSS reference signal, 6 words per minute
Audio file 13 dB higher (20x power) than the QRSS reference signal, 6 words per minute
Audio file 16 dB higher (40x power) than the QRSS reference signal, 6 words per minute
Audio file 20 dB higher (100x power) than the QRSS reference signal, 6 words per minute
Configurations of the test signals (readable with a text editor)
12qrsssim1-reference10db6wpm.cfg
12qrsssim1-reference13db6wpm.cfg
12qrsssim1-reference16db6wpm.cfg
12qrsssim1-reference20db6wpm.cfg
Receiver bandwidth (length of the FFT sample array)

Normal bandwidth.
Cosine window; Sample rate 5512; FFT samples 16384; Bandwidth 417 mHz.

Larger bandwidth (2x).
Cosine window; Sample rate 5512; FFT samples 8192; Bandwidth 834 mHz.

Smaller bandwidth (0.5x).
Cosine window; Sample rate 5512; FFT samples 32768; Bandwidth 208 mHz.
Configurations of the test signals (readable with a text editor)
12qrsssim1-reference-3db.cfg
Interfering signals

An interfering signal at the lower boundary of the QRSS signal with 2.5 Hz shift (1.25 Hz for FSK2).

An interfering signal in the centre of the QRSS signal with 2.5 Hz shift (1.25 Hz for FSK2).

An interfering signal at the upper boundary of the QRSS signal with 2.5 Hz shift (1.25 Hz for FSK2).

An interfering signal at the lower and upper boundary of the QRSS signal with 2.5 Hz shift (1.25 Hz for FSK2).
Configurations of the test signals (readable with a text editor)
12qrsssim1-0dbinterfererlo.cfg
12qrsssim1-0dbinterferermid.cfg
12qrsssim1-0dbinterfererhi.cfg
12qrsssim1-0dbinterfererloandhi.cfg
Fading

Fast fading (1 Hz).

Average fading (0.1 Hz).

Slow fading (0.01 Hz).
Configurations of the test signals (readable with a text editor)
12qrsssim1-10db1hzfading.cfg
12qrsssim1-10db0.1hzfading.cfg
12qrsssim1-10db0.01hzfading.cfg
Deviation (shift)

Small shift: The 0 dB QRSS signal with 1.25 Hz shift (0.625 Hz for FSK2).

Reference shift: The 0 dB QRSS signal with 2.5 Hz shift (1.25 Hz for FSK2).
Larger shift: The 0 dB QRSS signal with 5 Hz shift (2.5 Hz for FSK2).
Even more large shift: The 0 dB QRSS signal with 10 Hz shift (5 Hz for FSK2).

Really large shift that will never be used in practice: The 0 dB QRSS signal with 20 Hz shift (10 Hz for FSK2).

Co-interference. Various signals do interfere with each other.
With a smaller shift, they do use less frequency space and would perhaps be separately visible.
Also the relation between the mark and space signals is better visible with a smaller shift.
Configurations of the test signals (readable with a text editor)
12qrsssim1-0db1.25hz.cfg
12qrsssim1-reference0db.cfg
12qrsssim1-0db5hz.cfg
12qrsssim1-0db10hz.cfg
12qrsssim1-0db20hz.cfg
ARGO special mode, the Polyfase FFT

The 0 dB reference QRSS signal with 2.5 Hz shift (1.25 Hz for FSK2) displayed in Lopora.
The 0 dB reference QRSS signal with 2.5 Hz shift (1.25 Hz for FSK2) displayed in Argo with Polyfase FFT.
The 0 dB reference QRSS signal with 2.5 Hz shift (1.25 Hz for FSK2) displayed in Argo without Polyfase FFT.
part 2 of the 0 dB reference QRSS signal with 2.5 Hz shift (1.25 Hz for FSK2) displayed in Argo with Polyfase FFT.

Part 2 of the 0 dB reference QRSS signal with 2.5 Hz shift (1.25 Hz for FSK2) displayed in Argo without Polyfase FFT.

3 dB weaker (0.5x power) than the 0 dB reference signal displayed in Lopora.
3 dB weaker (0.5x power) than the 0 dB reference signal displayed in Argo with Polyfase FFT.
Part 2 of the 3 dB weaker (0.5x power) than the 0 dB reference signal displayed in Argo with Polyfase FFT.
Configurations of the test signals (readable with a text editor)
12qrsssim1-reference0db6000rate.cfg
12qrsssim1-reference-3db6000rate.cfg
Window choice
For this test, a QRSS reference signal is simulated with a 30 dB (1000x power) higher and a 40 dB (10000x power) higher interference signal. Without window function, strong noise side bands are generated in the FFT analysis. Here they are even so strong, that the QRSS signal is just hardly visible. But at the second picture, a window function is used. And... the noise bands are much lower. By the application of a window function, the slope of the FFT filter becomes much better. But the FFT filter becomes also a little wider. The increase of the slope goes at the expense of the selectivity. The cosine filter is a good compromise between a good slope and a good selectivity.
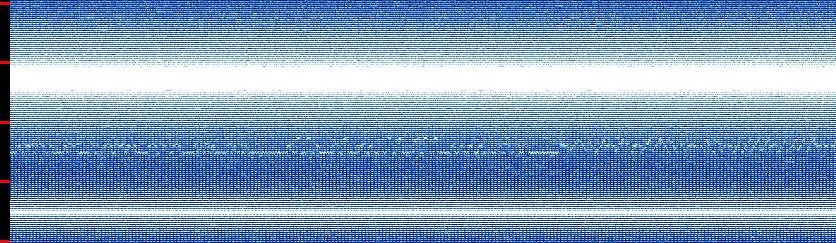
No window or also named rectangular window.
Cosine window.

Nuttall window.
Nuttall window and double FFT sample length 32768 instead of 16384 to make a small bandwidth with a good dynamic range.
Configurations of the test signals (readable with a text editor)
12qrsssim1-0dbstronginterferers.cfg
Final conclusions
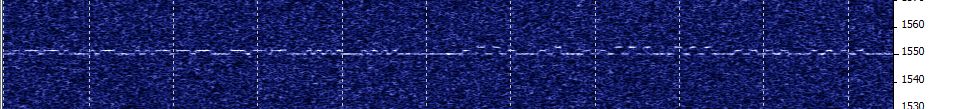
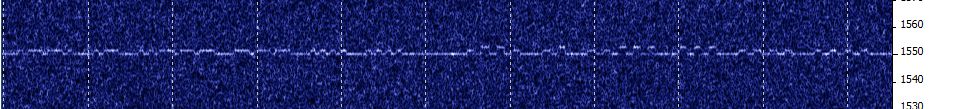
Grabber example of the QRSS signal with 1.25 Hz shift for FSK2 and 2.5 Hz for FSK3 and CHIRP instead of the usual 5 Hz
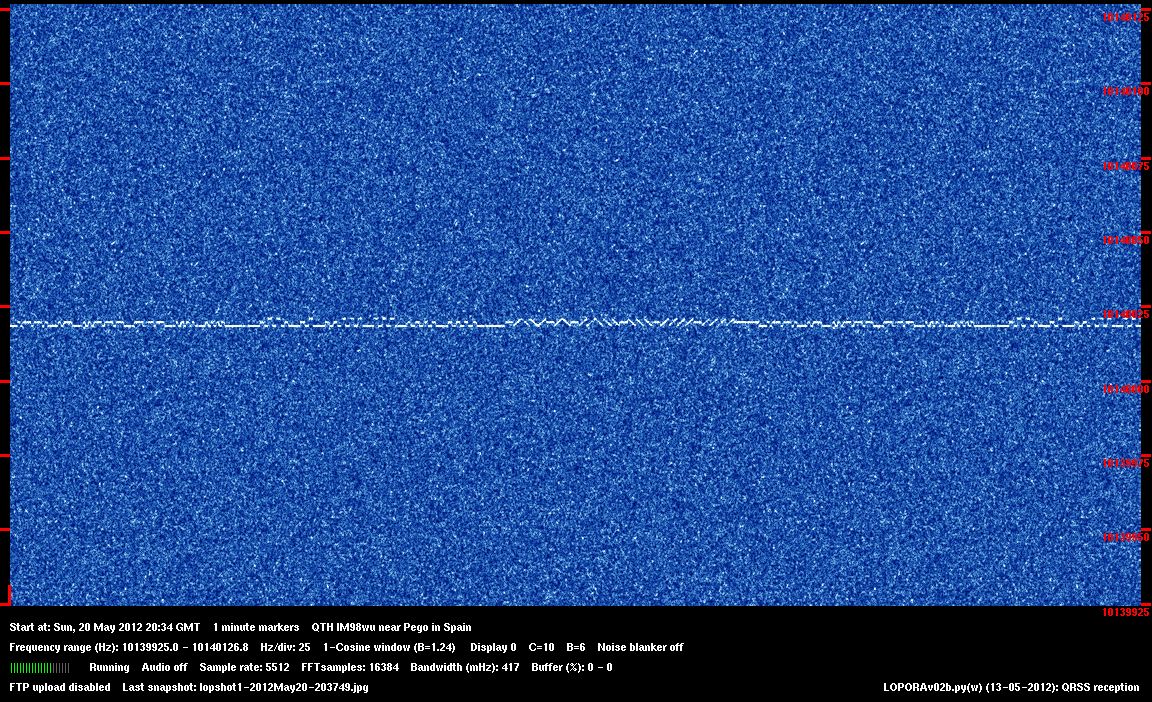
Grabber example of the QRSS signal with 1.25 Hz shift for FSK2 and 2.5 Hz for FSK3 and CHIRP instead of the usual 5 Hz.