For the following experiments I need a 3D plot. Because I wanted to know how to make a 3D plot I programmed it myself. There is a lot of information on the internet and a lot of examples. This is how I did it:
package util;

import java.awt.Color;
import java.awt.Frame;

public class ShowPlot3d extends Frame {
	/**
	 *
	 */
	private static final long serialVersionUID = 1L;
	private double[][] plotData3d;
	java.awt.Button panL = new java.awt.Button();
	java.awt.Button panR = new java.awt.Button();
	java.awt.Button showMin = new java.awt.Button();
	java.awt.Button showMax = new java.awt.Button();
	java.awt.Button zoomIn = new java.awt.Button();
	java.awt.Button zoomOut = new java.awt.Button();
	java.awt.TextArea txaInfo = new java.awt.TextArea();
	String txaText = "";
	public int zoomFactor = 1;
	String title;

	public ShowPlot3d(int id) {
		plotData3d = null;
		setLayout(null);
		setSize(1000, 768);
		setTitle("Show Figure " + id);
		SymWindow aSymWindow = new SymWindow();
		this.addWindowListener(aSymWindow);
		setVisible(false);
		panL.setLabel("panL");
		add(panL);
		panR.setLabel("panR");
		add(panR);
		showMin.setLabel("minimum");
		add(showMin);
		showMax.setLabel("maximum");
		add(showMax);
		zoomIn.setLabel("zoom in");
		add(zoomIn);
		zoomOut.setLabel("zoom out");
		add(zoomOut);
		SymAction lSymAction = new SymAction();
		panL.setBackground(java.awt.Color.lightGray);
		panL.setBounds(10, 30, 150, 40);
		panL.addActionListener(lSymAction);
		panR.setBackground(java.awt.Color.lightGray);
		panR.setBounds(160, 30, 150, 40);
		panR.addActionListener(lSymAction);
		showMin.setBackground(java.awt.Color.lightGray);
		showMin.setBounds(310, 30, 150, 40);
		showMin.addActionListener(lSymAction);
		showMax.setBackground(java.awt.Color.lightGray);
		showMax.setBounds(460, 30, 150, 40);
		showMax.addActionListener(lSymAction);
		zoomIn.setBackground(java.awt.Color.lightGray);
		zoomIn.setBounds(10, 70, 150, 40);
		zoomIn.addActionListener(lSymAction);
		zoomOut.setBackground(java.awt.Color.lightGray);
		zoomOut.setBounds(160, 70, 150, 40);
		zoomOut.addActionListener(lSymAction);
		add(txaInfo);
		txaInfo.setBounds(610, 30, 200, 200);
		txaInfo.setVisible(true);
	}

	public ShowPlot3d(int id, double[][] plotData3d) {
		this(id);
		this.plotData3d = plotData3d;
	}

	public ShowPlot3d(int id, double[][] plotData3d, String title) {
		this(id, plotData3d);
		this.title = title;
	}

	class SymWindow extends java.awt.event.WindowAdapter {
		public void windowActivated(java.awt.event.WindowEvent event) {
			Object object = event.getSource();
			if (object == ShowPlot3d.this)
				ShowPlot_WindowActivated(event);
		}

		public void windowClosing(java.awt.event.WindowEvent event) {
			Object object = event.getSource();
			if (object == ShowPlot3d.this)
				ShowPlot_WindowClosing(event);
		}

		public void windowStateChanged(java.awt.event.WindowEvent event) {
			Object object = event.getSource();
			if (object == ShowPlot3d.this)
				ShowPlot_windowStateChanged(event);
		}
	}

	class SymAction implements java.awt.event.ActionListener {
		public void actionPerformed(java.awt.event.ActionEvent event) {
			Object object = event.getSource();
			if (object == panL)
				panL_ActionPerformed(event);
			else if (object == panR)
				panR_ActionPerformed(event);
			else if (object == showMin)
				showMin_ActionPerformed(event);
			else if (object == showMax)
				showMax_ActionPerformed(event);
			else if (object == zoomIn)
				zoomIn_ActionPerformed(event);
			else if (object == zoomOut)
				zoomOut_ActionPerformed(event);
		}
	}

	int shift = 0;

	void panR_ActionPerformed(java.awt.event.ActionEvent event) {
		shift += 100;
		txaText += "\n" + "shift = " + shift;
		txaInfo.setText(txaText);
		repaint();
	}

	void panL_ActionPerformed(java.awt.event.ActionEvent event) {
		shift -= 100;
		txaText += "\n" + "shift = " + shift;
		txaInfo.setText(txaText);
		repaint();
	}

	void showMin_ActionPerformed(java.awt.event.ActionEvent event) {
		shift = xlocmin - 500;
		txaText += "\n" + "min = " + minData;
		txaInfo.setText(txaText);
		repaint();
	}

	void showMax_ActionPerformed(java.awt.event.ActionEvent event) {
		shift = xlocmax - 500;
		txaText += "\n" + "max = " + maxData;
		txaText += "\n" + "x = " + xlocmax;
		txaText += "\n" + "y = " + ylocmax;
		txaInfo.setText(txaText);
		repaint();
	}

	void zoomOut_ActionPerformed(java.awt.event.ActionEvent event) {
		shift = shift * zoomFactor;
		zoomFactor++;
		shift = shift / zoomFactor;
		txaText += "\n" + "zoomFactor = " + zoomFactor;
		txaInfo.setText(txaText);
		repaint();
	}

	void zoomIn_ActionPerformed(java.awt.event.ActionEvent event) {
		shift = shift * zoomFactor;
		zoomFactor--;
		if (zoomFactor <= 0) {
			zoomFactor = 1;
		}
		shift = shift / zoomFactor;
		txaText += "\n" + "zoomFactor = " + zoomFactor;
		txaInfo.setText(txaText);
		repaint();
	}

	void ShowPlot_WindowClosing(java.awt.event.WindowEvent event) {
		setVisible(false); // hide the Frame
		System.exit(0);
	}

	public void ShowPlot_WindowActivated(java.awt.event.WindowEvent event) {
		// setVisible(true);
	}

	public void ShowPlot_windowStateChanged(java.awt.event.WindowEvent event) {
		repaint();
	}

	public void showFigure() {
		this.requestFocus();
		this.setEnabled(true);
		setVisible(true);
		setTitle(title);
		repaint();
	}

	public void setZoomFactor(int zoomFactor) {
		this.zoomFactor = zoomFactor;
	}

	double minData = 0;
	double maxData = 0;
	int xlocmin = 0;
	int ylocmin = 0;
	int xlocmax = 0;
	int ylocmax = 0;
	boolean plotSaved = false;
	double[] origPlotData;

	public void paint(java.awt.Graphics gc) {
		// 3D graphics
		int height = getHeight();
		int width = getWidth();
		double phix = 15; // degrees
		double phiy = 10; // degrees
		double phixrad = (phix / 180) * Math.PI;
		double phiyrad = (phiy / 180) * Math.PI;
		int xmax3d = plotData3d.length;
		int ymax3d = plotData3d[0].length;
		int origx = shift + width / 5;
		int origy = 2 * height / 3;
		// determine min and max z-value
		minData = plotData3d[0][0];
		maxData = plotData3d[0][0];
		for (int x = 0; x < xmax3d; x++) {
			for (int y = 0; y < ymax3d; y++) {
				double sample = plotData3d[x][y];
				if (sample < minData) {
					minData = sample;
					xlocmin = x;
					ylocmin = y;
				}
				if (sample > maxData) {
					maxData = sample;
					xlocmax = x;
					ylocmax = y;
				}
			}
		}
		double rangez = maxData - minData;
		double maxhi = 0.4 * height;
		double zscale = maxhi / rangez;
		for (int x = 0; x < xmax3d; x++) {
			for (int y = 0; y < ymax3d; y++) {
				int xx = 2 * x;
				int yy = 20 * y;
				double z3d = plotData3d[x][y];
				int xfrom = (int) (origx + xx * Math.cos(phixrad) + yy
						* Math.cos(phiyrad)) / 2;
				int yfrom = (int) (origy - xx * Math.sin(phixrad) + yy
						* Math.sin(phiyrad)) / 2;
				int zz = (int) (z3d * zscale);
				gc.setColor(Color.blue);
				if (zz > (maxhi * 0.25)) {
					gc.setColor(Color.green);
				}
				if (zz > (maxhi * 0.5)) {
					gc.setColor(Color.yellow);
				}
				if (zz > (maxhi * 0.75)) {
					gc.setColor(Color.red);
				}
				gc.drawLine(xfrom, height - yfrom, xfrom, height - yfrom - zz);
			}
		}
	}
}
|
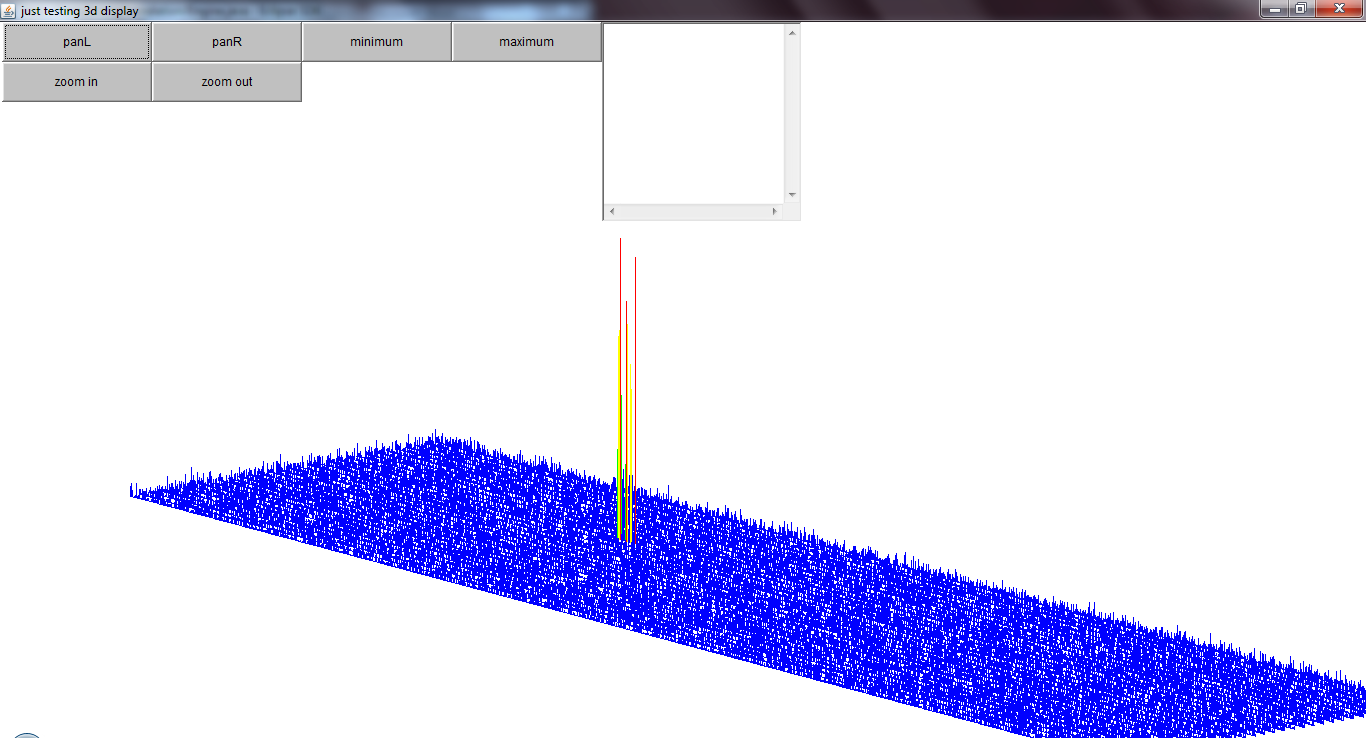
The test-input for the plot-class:
	public void fillArray15() { // use fake-data to test 3d-display
		int xmax3d = 1023;
		int ymax3d = 32;
		double[][] plotData3d = new double[xmax3d][ymax3d];
		System.out.println("plotData3d[0].length = " + plotData3d[0].length);
		System.out.println("plotData3d.length = " + plotData3d.length);
		Random r = new Random();
		int noise = 5;
		for (int x = 0; x < xmax3d; x++) {
			for (int y = 0; y < ymax3d; y++) {
				int peak = 0;
				if (x > 300 && x < 320 && y == 20) {
					peak = 20;
				} else {
					peak = 1;
				}
				plotData3d[x][y] = peak * Math.abs(noise * r.nextGaussian());
			}
		}
		int id = 1;
		ShowPlot3d myPlot = new ShowPlot3d(id, plotData3d, "just testing 3d display");
		myPlot.showFigure();
	}
|
and the output of this all: