 Chirp
sounder and Ionogram project
Chirp
sounder and Ionogram projectI have always wanted to be able to make my own Ionograms, but never knew how.
In 2000 Peter G3PLX started his Chirp project using Chirp sounders to study the ionosphere.
He constructed a DSP chirp filter to be able to detect passing sounders on a fixed frequency.
Andrew G0TJZ implemented a chirp filter for the soundcard in his program CHIRPVIEW.
With CHIRPVIEW and a GPS receiver with PPS (pulse per second) output I could do the same
long term observations that Peter and Andrew did. However I soon realized that by simply letting my
receiver follow the sounder in 100 kHz steps I could reconstruct Ionograms from the detect log.
The examples below show some of the interesting results I got so far.

Figure1 Inskip sounder showing the MUF for the Ordinary and Extra Ordinary ray

Figure 2 Cyprus sounder showing a typical Oblique Ionogram

Figure 3 Inskip Ionogram showing Sporadic E

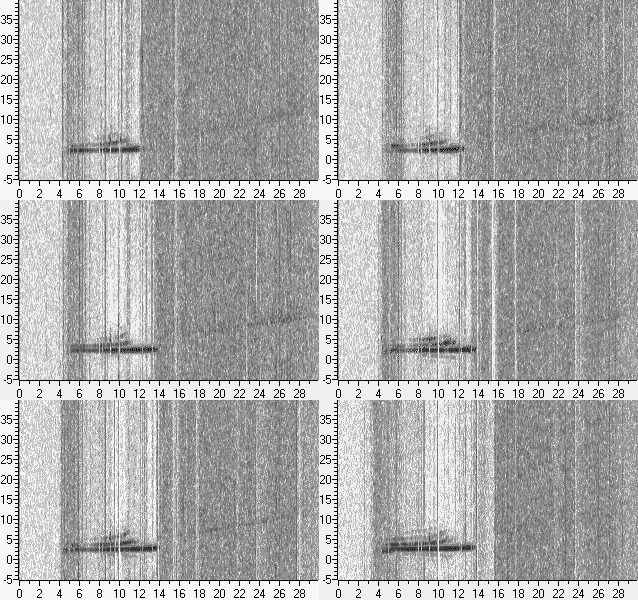
Figure 4 Backscatter propagation observed with the Cyprus sounder
 Fig
4 shows an interesting mode of propagation: Backscatter. As the
frequency exceeds the MUF the propagation delay suddenly jumps to twice
the normal delay. Normally beyond MUF no propagation is possible. The
receiver is situated in the dead zone around the transmitter. In this
case the dead zone around Cyprus is just above 3000 km, the distance
between my location and Cyprus. The only possible mode of propagation
to reach a receiver within the dead zone is backscatter. As a radio
wave hits the earth most of the energy is reflected in the same
horizontal direction as the incident wave was traveling. However
because the Earth is not a perfect reflector a small part of the energy
is scattered in all directions. Some of it may be reflected by the
ionosphere and reach receiving stations within the dead zone. An
interesting question is : where does the signal come from ?
Fig
4 shows an interesting mode of propagation: Backscatter. As the
frequency exceeds the MUF the propagation delay suddenly jumps to twice
the normal delay. Normally beyond MUF no propagation is possible. The
receiver is situated in the dead zone around the transmitter. In this
case the dead zone around Cyprus is just above 3000 km, the distance
between my location and Cyprus. The only possible mode of propagation
to reach a receiver within the dead zone is backscatter. As a radio
wave hits the earth most of the energy is reflected in the same
horizontal direction as the incident wave was traveling. However
because the Earth is not a perfect reflector a small part of the energy
is scattered in all directions. Some of it may be reflected by the
ionosphere and reach receiving stations within the dead zone. An
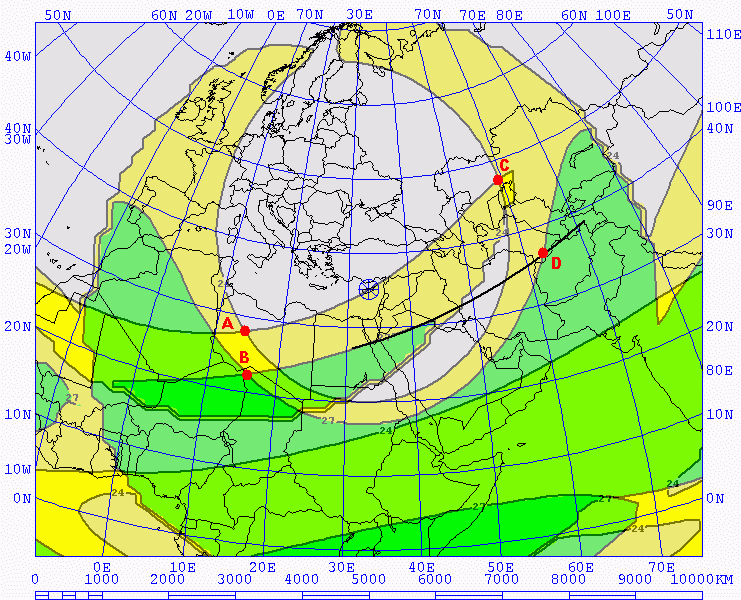
interesting question is : where does the signal come from ?First of all, the region responsible for this ground scatter must be outside the dead zone surrounding the sounder. Furthermore, signals originating from within the dead zone around the receiving station will not be reflected by the ionosphere. Therefore the origin of the backscatter signal must be just outside both dead zones. In other words: 3000 km away from Cyprus and 3000 km away from the Netherlands. This leads to two possible locations: The Sahara desert and the Ural mountains. As the frequency increases the dead zones will grow and the scatter area will move further away, which explains the increasing delay. Now, this was based on the presumption that the dead zones have a circular shape. In reality they don't. To find the real MUF contours I used ICEAREA from the ITS propagation prediction package.

The plot shows the MUF contours for
24 and 27 MHz, the range in which the scatter signals were received. Now
we can measure the distance from each intersection (A, B, C and D) to
both Cyprus and The Netherlands and see if they match the delay that was
actually measured. The total distance from Cyprus to A and then from A
to The Netherlands is 4740 km corresponding to a delay of 15.8 ms at 24
MHZ. In the same way point B gives a total distance of 5714 km with a
delay of 19 ms on 27 MHz. The possible scatter area in Northern Africa
does not fit the delay measured at 21 ms on 24.5 MHz and 25 ms on 27
MHz. Point C gives a total distance of 6402 km corresponding to 21.3 ms
and point D 7540 km and 25.1 ms. This is an almost perfect fit to the
measured data. The conclusion must be that the area responsible for
generating the backscatter is roughly situated in Kazakhstan and shifts
towards Afghanistan with increasing frequency.
 |
Finally, this is an animation of
ionograms taken with the Inskip sounder. It clearly shows the faint
backscatter trace visible beyond MUF. The film consists of 20 frames taken at the normal 5 minute interval. Total duration therefor is 100 minutes, or litle over one and a half hour. |
Links:
Real time ionograms + movies
http://www.rcru.rl.ac.uk/ionospheric/examples.htm
http://hfsounder.lanl.gov/
http://ionet-us.crl.go.jp/index_eng.html
http://home.planet.nl/~pa1six/pa1six.htm
Overview Chirpsounders
http://www.pacificsites.com/~brooke/PC0993tbl.html
http://aintel.bi.ehu.es/chirps-data/chirps.html
Chirpview
http://www.asenior48.freeserve.co.uk/chirpview.html
Other
http://www.qsl.net/zl1bpu/chirp/chirps.html
http://www.pacificsites.com/~brooke/MWI.shtml
http://ion.le.ac.uk/iris/experiment.html
