Presentation Paper
02 August 2002
Earthquake Precursor Experiments: Exploring Mysterious Earthquake Preparation Physics with
Amateur Built Sensors and Data Networks
by Sam Stanifer
This paper is adapted from a poster session presented at the First Annual Citizen Science Conference, Philadelphia, June 28-29, 2002.
Overview
A project of the Los Angeles Chapter, "Earthquake Precursor Experiments", seeks to involve interested persons in the research, design, development and
construction of sensors to detect various phenomena known or suspected to precede earthquakes.
Another integrated element of the project would be to design and develop a data collection system for the sensors, which would collect and forward their data
via existing amateur radio packet networks. The sensors would then be deployed in locations optimized for the detection of the precursor phenomena, and
the data collection network would send the information to central sites for analysis and archival.
Many researchers in this relatively new discipline of earthquake precursor physics have cited the need for networks to capture various phenomena
associated with earthquake preparation. Observations thus far have largely been fortuitous, collected with instruments designed for other purposes and
confined to a small area. It is a broad goal of this project to stimulate development of such networks by amateurs.
The initial impetus for the project was "The Amateur Scientist" column of May 1996, entitled "Detecting Natural Electromagnetic Waves". The article
described a magnetometer, built with hand tools, which could detect the ULF (Ultra Low Frequency) signals attributed to some earthquakes in the
preparation phase. The work of Dr. Jack Dea was cited as a foundation for experiments that could be undertaken with this homebuilt magnetometer. Our
project expanded the scope to include other precursor signals, beyond the ULF phenomena described in Shawn's 1996 column. Other candidate precursor
signals include various soil gases known to appear before earthquakes. Some of these have been identified as radon, methane, carbon dioxide, hydrogen,
helium and mercury vapor. Still other precursors that might be detected with amateur built sensors are anomalies of the atmospheric electric field, the
near-earth atmospheric ion count, the ionosphere and earth currents. Yet others are electrostatic phenomena, subsurface temperature increases, soil gas
mobility, changes in the night airglow spectral properties and ground tilt. Design of sensors that might detect these precursor possibilities would necessarily
cross into a number of different disciplines of science, and could challenge SAS members worldwide to contribute in a meaningful way to this frontier where
little is known or understood. Participants in the project, either in a hands-on or advisory role, include Hank Burwash, Joe Cascarano, Dr. Jack Dea, Dr.
Joseph DiVerdi, Tim Dolan, Jim Gray, Jim Hannon, Joe Krigbaum, Stan Martins, David Scott and Sam Stanifer. Others supporting the project with offers to
site our equipment on their property include Steve Bartlett, Phil Brittain, Phil Culbert and Bruce Vail. The project web site www.qsl.net/kj6bu provides
additional information.

Tim Dolan, software guy.
Tim is developing means to compute and display the spectral content of data obtained from the Conix magnetometer, for the ULF monitoring project. In a
step-wise manner, he suggested that we first collect data by sampling the magnetometer output in a realistic environment, record the data, and then develop
or modify existing software so as to process the necessary spectral analysis on the raw data collected.
Initially, he would test the sampling algorithms, with follow-on work oriented to completing the code for the spectral (FFT) processing.
Accordingly, Tim and Jim Gray put together an equipment package to accomplish this intermediate goal. We packed up everything and hauled it to (SASers)
Russ and Janet Bates' property in Hesperia, California.

A small portion of the many preparations for the field trip.

Jim Gray in his well equipped lab.
Jim graciously leads the way concerning hardware issues in our various projects. He built, with stunning precision, his adaptation of the ion counter
described in Shawn's Amateur Scientist column, 'Counting Atmospheric Ions', of September 1999.
Dr. Jack Dea, U.S. Navy Physicist (left).
Jack confers with Sam Stanifer in San Diego. He provides our group with guidelines for software and hardware aspects of the ELF monitoring project.
Jack and Shawn Carlson conceived the idea for a network of amateur observers to contribute to our understanding of natural radio and its relationship to
tectonic processes and the space environment. This was first proposed as an SAS project in Shawn's Amateur Scientist column, "Detecting Natural
Electromagnetic Waves", May 1996, and evolved into our current project.
Jack's numerous publications dealing with ELF signals as possible earthquake precursors include:
"Observations of seismo-electromagnetic earthquake precursor radiation signatures along Southern California fault zones: Evidence of long-distance
precursor ultra-low frequency signals observed before a moderate Southern California earthquake episode", Can. J. Phys. 69, 1138 (1991)
"Long-term ELF background noise measurements, the existence of window regions, and applications to earthquake precursor emission studies", Physics of
the Earth and Planetary Interiors, 77 (1993) 109-125

Hank Burwash and Joe Cascarano record radiation data on a continuous basis. Instrument is an
RM-60, by Aware Electronics.
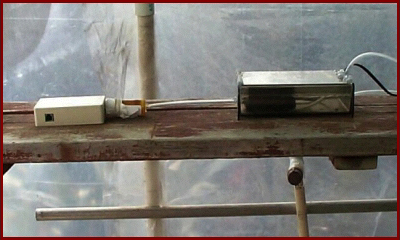
Hank's homebrew pump, on the right, draws soil gases from beneath a
greenhouse in his backyard. RM-60 is on the left.
Earthquake occurred January 17, 1995.
Stan Martins, Environmental Scientist Click image to enlarge
Stan has extensive background and experience with soil gas Radon propagation studies, both at Lawrence Livermore Labs, and as a private consultant. He
has graciously offered us benefit of his analysis skills by examining, reordering and plotting experimental Radon data we have been collecting, as well as
data collected by others.
A recent example is the chart Stan produced from atmospheric Radon data collected at a site near the epicenter of the January 17, 1995 Kobe
earthquake1. The original data showed a dramatic drop, and then an equally impressive rise of the Radon count in the months/days prior to the earthquake.
Stan digitized the original chart, and ordered the data to reflect the seasonal variations over the two years of available data. The resulting chart clearly
suggests the Radon flux as measured near Kobe has a seasonal component. This is valuable information for future data collection from our 'deployed' Radon
sensors.
Using similar techniques, Stan has examined some of the data we have collected in Los Alamitos. He has, for example, graphically compared the measured
Radon fluctuations with barometric pressure, and with lunar events.
1. Y. Yasuoka and M. Shi-nogi, Health Physics 72, No. 5, pp 759-761 (1997), Anomaly in Atmospheric Radon Concentration: Possible Precursor to the
1995 Kobe, Japan, Earthquake
Conix Research Magnetometer, ULF experiments. Click
image to enlarge
The view above is a prototype unit of the magnetometer, on loan from Dr. Jack Dea. The three coils are to the right. Each of the PVC pipe housings contains
a coil wound on a high permeability core, and a preamplifier. The coils are fastened together, and are oriented (in operation) such that the Z-designated axis
is vertical. The X-axis and the Y-axis would then be oriented North-South, and East-West, respectively.
The controller is shown in the foreground. Raw, analog data is brought into the controller, where a microprocessor digitizes and multiplexes the data, and
formats it for RS-232 digital output. A bar graph, and a numerical display show the instantaneous magnitude of the digital signal from each axis on the LCD
display on the front of the controller. The raw analog data is also available via three BNC connectors on the rear of the controller.
Figures courtesy Canadian Journal of Physics, and the author, Dr.
Jack Dea. Click images to enlarge
Spectral analysis of vertical search coil data, prior to the Upland, California M 4.6 earthquake of April 17, 1990. Top figure shows the typical background
power spectrum. The bottom figure shows the spectrum from the same instrument one day before the earthquake. The 0.1 to 5 Hz power spectra region is
elevated (+7 dB) over the quiet levels.
Original figure courtesy Canadian Journal of Physics, and the author, Dr. Jack Dea.
Composite showing difference between quiescent and elevated levels: vertical search coil,
before the M 4.6 Upland, California earthquake of April 17, 1990. Click image to enlarge
The lower trace is spectral data taken with the vertical coil on the 10th of April 1990. The typical background power spectrum is relatively flat between
0.1 and 5 Hz.
The upper trace, highlighted in red, is spectral data taken from the same coil one day prior to the earthquake.
Sensor was located near San Diego, about 200 Km from the epicenter of the earthquake.
One day after the earthquake, the levels returned to near-normal background levels.
Field trip: attempt detection of the Schumann resonance phenomena.
Click image to enlarge
Shown is the magnetometer controller and laptop running "Spectrogram". Coils were about 200 feet away. The tests were inconclusive. The Schumann
resonance should be apparent at about 7.8 Hz, and 14 Hz.
Click image to enlarge
Tim Dolan's modification of Dr. Jack Dea's Software
Tim has re-created Jack's software to accept data from a parallel port A/D device. The original software was written to address a laboratory board. Availability
and expense of the original hardware were factors in deciding to rewrite the software.
This screen shot shows the result of the software processing data collected in Hesperia during June 2001. The power spectrum is derived from first
calculating the Fast Fourier Transform (FFT) of the digitally sampled analog data produced by one coil of the Conix prototype magnetometer. Sampling of the
data is accomplished at a rate of 40 Hz, and the FFT is calculated after collecting 1024 points of information. The display results from averaging four
1024-point samples.
The power spike showing at about 12 Hz. is an unknown artifact, either of the magnetometer, or the noise environment at the Hesperia site.
The program was designed to analyze spectral properties of geophysical signals below 20 Hz. Jack's work suggests that there may exist an earthquake
"window", above the region of naturally occurring geomagnetic pulsations below one Hz, and below the region of the lightening-excited first Schumann mode
at about 7.8 Hz.
Click image to enlarge
Stan's charts produced from the RM-60 data at Hank's residence in Los Alamitos, California.
These charts show six-hour totals of the count received from the instrument, superimposed with actual earthquakes that are selected to be within:
Click images to enlarge
1. 300 Kilometers of the sensor (chart on the left)
2. 450 Kilometers of the sensor (chart on the right)
Note that after rapid, sustained changes in the Radon flux, earthquakes seem to follow within a day or so. In addition, the larger spikes in the flux seem to
"precipitate" larger earthquakes.
Another interesting observation is noted by comparing the increased number of near-simultaneous earthquakes when the 450 Kilometer "filter" is selected.
This suggests that the Radon flux we are measuring is either the consequence, or the cause of events in a huge area.
The two larger earthquakes that occurred during the data recordings shown here were:
M 5.7 February 22, 2002 Near Calexico, CA
M 4.6 March 16, 2002 offshore, near Santa Barbara Island
Click images to enlarge
Electrometer built from SAS article by Richard Hull
Click image to enlarge
This amateur Electrometer is a low cost version of what is normally a $5000 to $10,000 instrument. The parts for this one cost about $20.
A very high impedance input is achieved by the use of an FET (Field Effect Transistor) Integrated Circuit for the first stage of the Electrometer. The input
impedance is so high (teraohms) that the instrument can resolve voltages that would otherwise be leaked away and swamped back to zero by other meters
of lower impedance.
The original article by Richard Hull, from which this Electrometer was built, notes that "tapping one's toe in time with music while sitting on a modern carpet
can induce a +/- ten volt potential change on a can of Spam five feet away. This instrument should respond to voltages of ~ +/- seven volts."
Comments from various references support a hypothesis that large earthquakes are preceded by electrostatic phenomena, and/or ionization of the near-earth
atmosphere:
Electrostatic forces caused unassembled watch parts to repel one another prior to a large earthquake, Friuli, Italy, 1976
Earthquakes were found to occur more often at times of lowered electrical fields than normal circumstances, Matsushiro earthquake swarm,1966.
A Volta electrometer (electroscope) showed powerful electric discharges of both positive and negative polarity prior to a large earthquake in Cumana,
Venezuela, 1799.
"There was an obviously strong change in the electric field of the earth which preceded the earthquake", Chinese scientist Deng Qi-dung on the
Haicheng earthquake, 1975.
"This leads us to the conclusion that a great difference in potential ionized the air". (H.Tributsch comments on the Haicheng observations above.)
Packet Radio data communications device.
Click image to enlarge
The MIM is a low cost means of sending low rate data over Amateur Radio circuits. It encodes five channels of analog data at eight bits, formats the data for
packet AX.25 protocol, and sends tones to an FM transmitter. It provides for up to eight "hops" via digital repeaters to reach an intended destination.
All five analog channels are updated at specified intervals. Normally, an interval of about 30 minutes is used, to avoid unwanted loading of the R.F. channel.
Hank Burwash, KQ6RG, and Sam Stanifer, KJ6BU, with the able assistance of Joe Krigbaum, K6NE, ran some on-the-air experiments with the MIM. Data
frames were sent from Ventura to the Long Beach vicinity, a distance of about 70 miles, via several digital repeaters.