'Scope waveforms of the SW-40+
Some oscilloscope waveforms of the keying process have been taken to show how the radio switches from receive-to-transmit and back. The oscilloscope is particularly useful here. Waveforms of the final amplifier base and collector voltage are shown as well.
Equipment setup:
A TDS210 digital oscilloscope with two x10 attenuator probes was used to capture the waveforms. A function generator was used to "key" the rig in a predictable way: the transmitter was activated for a time period of 0.18 seconds, and then the receiver was allowed to operate for another 0.80 seconds. Keying was repeated continuously this way. Antenna connection went to a 50-ohm dummy load. No headphone was connected (open-circuit). DC power came from a regulated bench supply at 12.3v.
For the keying waveforms, the 'scope was triggered "externally", directly from the function generator that was keying the radio. An analog 'scope usually displays waveforms that start the sweep at the left coincident with the triggering event. With a digital 'scope like the TDS210, you can see stuff that happens before the trigger event. So some waveforms would be very difficult to duplicate exactly if you're using an older-style scope.
Oscilloscope waveform data was transferred to a PC computer over a serial port. Data was imported to a spreadsheet where it was graphed. WINDOWS Paintbrush was used to cut-n-paste some graphs together, and annotate and title them.
Waveforms explained, scope triggering
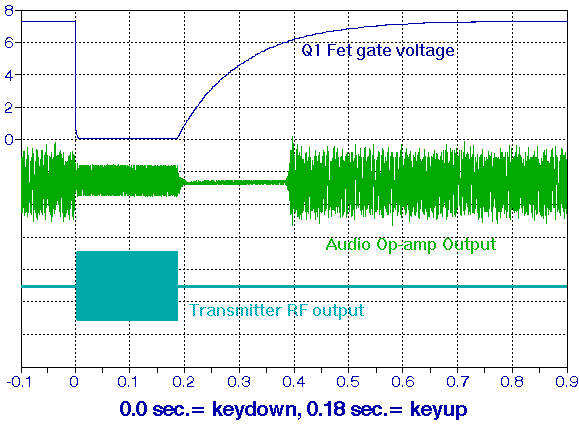
The first graph shows one keying event, lasting 0.18 seconds. The trace actually starts at the left 0.10 seconds BEFORE the key activates. The timescale is shown so that 0.0 seconds corresponds to the moment when the key is activated.
If you're setting up a 'scope to view these waveforms, you might want to connect one channel to the keyline, say channel 1. You'd set the 'scope to trigger from channel 1, negative slope (falling edge), and DC coupled. Many scopes will require that you switch to "normal" triggering rather than "auto" at these slow sweep speeds. Adjust the trigger level while keying the radio till you see that hitting the key initiates a sweep. The scope screen should be blank if you don't key the rig.
Now you can use the other channel (channel 2) to probe around the radio and view various parts of the radio that only change when keying is activated. Of interest are the FET gate (Q1), the transmit supply switch (Q3), RF amplifier (Q4, Q5) and perhaps the transmit mixer (U5).

These waveforms represent Q1's gate voltage (top in dark blue), the audio output at pin 7 of U4 (middle in green) and the 7 MHz. RF transmitter output at the antenna (bottom in cyan).
During the first 0.1s at the left, you can see audio (noise) output from U4, pin 7 up until the key is hit. The sweep here is so slow that you can't see the waveform going up and down, but you can see its "noisy" envelope. Very soon after the key is activated, the FET switch opens up, and the rig starts transmitting. During this time, audio consists of a constant-amplitude sidetone of about 800 Hz. When the key is released, both the transmitted waveform and the sidetone stop.
After that, the audio output is silent for a while, till the FET gate charges back up. Then the FET switches back ON and audio noise re-appears for the rest of the trace.
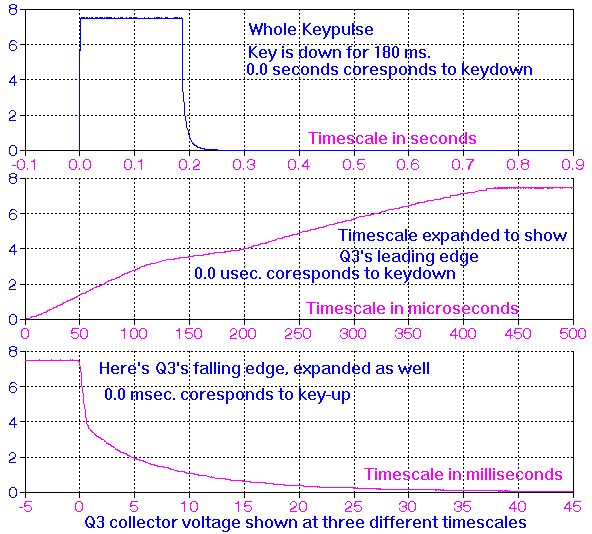
The keyline not only opens up the FET gate, but it turns ON the transmitter amplifer supply via Q3. The next set of three traces explores the keying timing involved with raising, and lowering the supply to U5. Voltage rises up to 7.5 volts, where zener diode D11 conducts. Q3's collector continues all the way up to +12v.

The top trace shows U5's supply at the same timescale as the previous traces: key is activated at 0.0s and de-activated at 0.18s. Q3 pulls up to nearly 12v very quickly after the key it activated. The middle trace examines its rising edge in more detail - notice that the sweepspeed is much faster than the top trace, and that the keydown event occurs at the extreme left edge of the sweep. U5's supply ramps up to 7.5 volts about 430 microseconds after the key is activated.
The bottom trace examines Q3's falling edge, showing how it falls from 7.5v back to zero. Here, 0.0 seconds corresponds to the key-up event. Q3 actually turns off quickly, but charge on C110 takes time to bleed away.
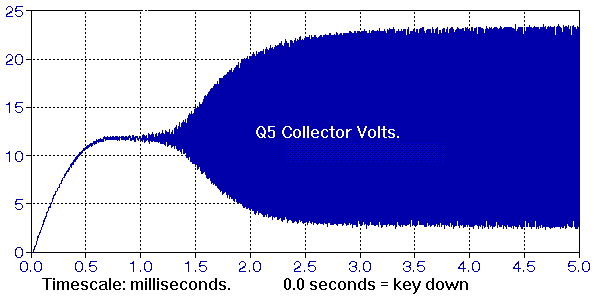
Well, its fine to see the supply voltage going up and down, but does the RF waveform follow it in a similar fashion? No, it lags a bit, as the next trace shows. Q5's collector voltage is shown as the key is activated. You can see that it exponentially rises up to +12v when Q3 turns on, but RF doesn't come out immediately.
 The RF
envelope (at 7 MHz) starts to come out about 1 millisecond after
keying, and only rises to full amplitude after about 3
milliseconds.
Although U5's supply is up to 7.5v after only 0.43 ms., its 4 MHz. crystal oscillator (connected to pin 6, and pin 7) takes some time to build up. U5's output at 7 MHz. depends on the oscillator, and doesn't come up right away. The laggard RF goes thru the buffer at Q4 and into Q5.
The last waveform here hasn't anything to do with keying. It shows the 7 MHz. voltage waveforms around Q6, the final RF amplifier. RF drive was a little high, so that two watts output was sent to the 50-ohm dummy load. The collector waveform's average voltage is +12v. It swings down to ground (Q6 is conducting a lot of current at this time). But when Q6 is not conducting, its collector voltage swings high above the supply voltage on the rebound - up to 28v. This transistor is working somewhat beyond class C, since it is saturated when ON.

Base voltage is limited by D6 on the negative swing, and by the base-emiter of Q6 on its positive swing. Its the positive swing that turns Q6 ON - while the base voltage swings negative, Q6 is OFF.