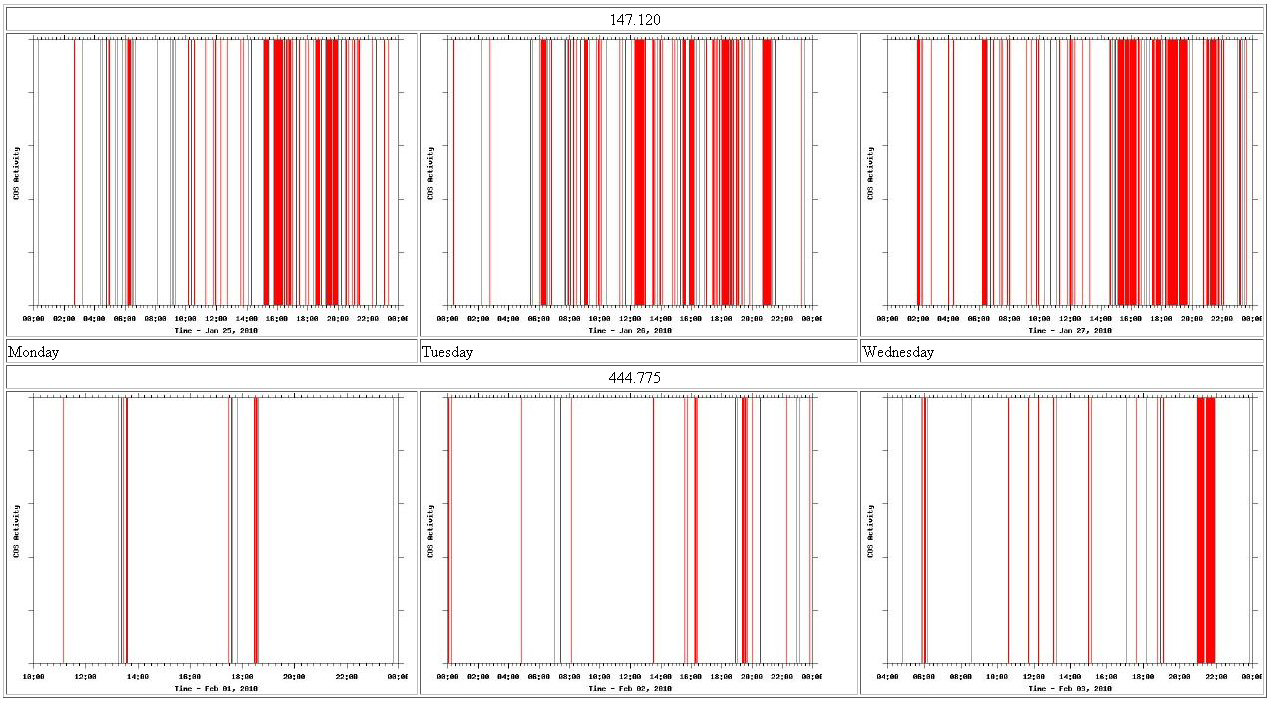
In this piece of documentation, I show how to generate on the fly line graph image files of repeater activity. This is handy to identify what time of day a system is most active. You can have the graph export to a club website or just about anything you can think of. I have the file output use the day of week name in it, so you can easily look at weeks worth of data.
I originally implemented this on the IRLP computer that was already interfaced to our repeater. Later in this document I show how to accomplish the same using a Vellman K8055 USB interface board. I also show how to compare total daily activity day to day, etc.
With IRLP Hardware:
IRLP has a readinput binary for troubleshooting. This reports; cos active, cos inactive, ptt active, ptt inactive, and all dtmf decoded. Since this Linux computer is always connected to your repeater system you can use it as a data basis to generate a visual graph of system activity using gnuplot, a portable command-line driven interactive data and function plotting utility.
Step One: is to generate a log with timestamps of COS
activity.
Here is a simple perl timestamp wrapper.
readinput | timestamp >> log
#!/usr/bin/perl
#
# timestamp
# Add a time stamp to each line received from STDIN
# send results to STDOUT
while (<>) {
chomp;
$ts = `date '+%b %d %Y %T'`;
chomp $ts;
print "$ts: $_\n";
}
The permissions on this are set to 750 and that it is owned by repeater.
Here is a sample output: /home/irlp/bin/readinput | /home/irlp/custom/timestamp
Jun 13 2004 12:14:32: COS ACTIVE
Jun 13 2004 12:14:33: COS INACTIVE
Jun 13 2004 12:14:41: COS ACTIVE
Jun 13 2004 12:14:41: DTMF 6
Jun 13 2004 12:14:42: DTMF 9
Jun 13 2004 12:14:42: COS INACTIVE
Jun 13 2004 12:14:43: PTT ACTIVE
Jun 13 2004 12:15:21: PTT INACTIVE
You can use something like "readinput | timestamp >> log" to dump this to a file
This text log of activity is the underlying basis for generating the visual graph, as well as calculating total system time for the day.
Step Two: Is to parse the log and make a simple graph.
This script makes a simple graph as 'log.png'
It needs gnuplot 4.0.
--
#!/usr/bin/perl
# Setup
#
sub System {
if ((0xffff & system $args) != 0 ) {
print STDERR "error: $!\n";
exit 1;
}
}
$log1 = "log"; # Main unedited log
$log2 = "log.1";
$log3 = "log.2";
$log4 = "log.3";
$log5 = "log.4";
$log6 = "log.5";
$log7 = "log.6";
# Get main log date
#
$logdate = `/usr/bin/head -n 1 $log1`;
($a, $b, $c, $d, $e, $f) = split / /, $logdate;
$log_date = sprintf "%s %s, %s", $a, $b, $c;
# Clear out other dates
#
&System($args = "grep \"$a $b\" $log1 > $log2");
# Clear out local PTT & DTMF entries
#
&System($args = "grep -E -v '(PTT|DTMF|FORCE)' $log2 > $log3");
# Remove date entry and isolate time
#
&System($args = "cat $log3 | awk '{print \$4 \"\t\" \$6}' > $log4");
# Convert ACTIVE and INACTIVE to numerical values
#
&System($args = "cat $log4 | sed 's/INACTIVE/0/g' > $log5");
&System($args = "cat $log5 | sed 's/ACTIVE/1/g' > $log6");
# Clear off the last ":"
#
&System($args = "cat $log6 | awk -F: '{print \$1 \":\" \$2 \":\" \$3 \"\t\" \$4}' > $log7");
open F, "> log.gp";
print F "set xlabel \"Time - $log_date\"\n";
print F "set ylabel \"COS Activity\"\n";
print F "set nokey\n";
print F "set ticscale 2 1\n";
print F "set tics out\n";
print F "set samples 300\n";
print F "set autoscale\n";
print F "set xtics\n";
print F "set mxtics 8\n";
print F "set terminal png\n";
# Creates a dynamic filename based on the date
print F "set output \"COS-`date +%A`.png\"\n";
#print F "set output \"log.png\"\n";
print F "set xdata time\n";
print F "set timefmt \"%H:%M:%S\"\n";
print F "set format x \"%H:%M\"\n";
print F "set format y \"\"\n";
print F "set style line 1 lt 1 lw 1\n";
print F "plot \"$log7\" using 1:2 with imp ls 1\n";
close F;
&System($args = "/usr/bin/gnuplot log.gp");
exit;
Sample Output:
With a Vellman K8055 Interface:
The method above relied on IRLP hardware and was meant for clubs to implement. If you want to do this sort of thing for the sake of curiosity, so you can watch the trends on what time of day a particular repeater is used; the most all you need is a radio with a carrier squelch line and a Linux PC.
Fortunately most modern mobile radios have a 6 pin, mini-din packet radio jack that has COS signaling on pin 6. So the old days of locating the some sort of indicator point near the discriminator have been simplified.
Since more and more PC's are lacking serial and parallel ports this document with cover the use of a Vellman K8055 I/O board to "read in" the COS. (If you are interested in using a parallel port see my old WX Radio Alert Interface for ideas)
The K8055 interface board has 5 digital input channels and 8 digital output channels. In addition, there are two analogue inputs and two analogue outputs. The big kicker is that there is Linux support. There is a lot one can do with this board, which is why I picked it up. This is merely a simple starter idea.
What we will be doing is creating a Perl wrapper around the Linux k8055 library binary - http://libk8055.sourceforge.net/
To install the libk8055 package you will need libusb and libusb-devel. Compiling it is pretty straight forward. And usage works like this:
Syntax : k8055 [-p:(number)] [-d:(value)] [-a1:(value)] [-a2:(value)]
             [-num:(number) [-delay:(number)] [-dbt1:(value)]
             [-dbt2:(value)] [-reset1] [-reset2] [-debug]
        -p:(number)     Set board number
        -d:(value)      Set digital output value (8 bits in decimal)
        -a1:(value)     Set analog output 1 value (0-255)
        -a2:(value)     Set analog output 2 value (0-255)
        -num:(number)   Set number of measures
        -delay:(number) Set delay between two measure (in msec)
        -dbt1:(value)   Set debounce time for counter 1 (in msec)
        -dbt2:(value)   Set debounce time for counter 2 (in msec)
        -reset1         Reset counter 1
        -reset2         Reset counter 2
        -debug          Activate debug mode
Example : k8055 -p:1 -d:147 -a1:25 -a2:203
What it returns looks like a string of 6 numbers, separated by semicolons.
Example: 499;16;128;230;9;8
              499 : Measure done 499 msec after program start
              16 : Digital input value is 10000 (I5=1, all other are 0)
              128 : Analog 1 input value is 128
              230 : Analog 2 input value is 230
              9   : Counter 1 value is 9
              8   : Counter 2 value is 8
So we need to create perl script to pool the k8055 program and look at that second number, analog input 1. We will be generating a text log, in the same format, just like before with the IRLP hardware based logger Thusly the GNU plot script is called by the Cron every night, just like before. The perl script looks like this:
#!/usr/bin/perl
#
# Perl wrapper to watch the input of a Vellman K8055 board.
#
$last = 0;

while (){
  open L, "/usr/local/bin/k8055 |" or die "$!\n";
    while (<L>) {
      ($a, $b, $c, $d, $e, $f) = split ';';
        if ($b eq "1") {
          $state = "ACTIVE";
        }
        else {
          $state = "INACTIVE";
        }
          if ($b ne $last) {
            print "$b\n";
            system("echo `date '+%b %d %Y %T'`: COS $state >>log\n");
            $last = $b;
          }
      }

sleep 1;
}
exit;
#!/bin/bash
#
# Bash wrapper to watch the input of a Vellman K8055 board.
#
LAST=0
while true
do
B=`k8055 | awk -F ";" '{print $2}'`
##
if [ $B = "1" ];
   then STATE="ACTIVE"
fi
##
if [ $B = "0" ];
   then STATE="INACTIVE"
fi
##
if [ $B -ne "$LAST" ];
   then echo `date '+%b %d %Y %T'`: COS $STATE
fi
##
LAST=`echo $B`
sleep 1
done
TekPower TP4000ZC
The ultimate for data acquisition purposes is a multimeter that has a serial/USB interface. The TekPower TP4000ZC can be bought for around $35 and when combined with a simple python script (tp4000zc.py) it can bring readings to the command line. Depending on your Linux distro, you may need to install the Python serial port access library, commonly called "pyserial."
To limit it's output to just one line rather than a continuous re-sampling edit tp4000zc.py towards the very bottom you can add a break statement:
| Code: |
| def main(): dmm = Dmm() while True: val = dmm.read() print val.text #print val.numericVal break # main hook if __name__ == "__main__": main() |
root@dmm:~# python tp4000zc.py
13.7 volts DC
root@dmm:~#
root@dmm:~# python tp4000zc.py
0.0 kiloOhms
root@dmm:~# python tp4000zc.py
22.6 degrees Celcius
To disable Auto Power Off function, press "SELECT" key when powering on the meter.
Calculating total system time
The graph is handy to identify what time(s) of day a system is most active. What you may be seeking is a way to compare total daily activity day to day, etc. Here is how:
sub System {
if ((0xffff & system $args) != 0 ) {
print STDERR "error: $!\n";
exit 1;
}
}
# Use the line below to strip the last entry in the log file (log must end inactive)
&System($args = "sed '\$d' readinputlog > log");
#
&System($args = "grep -E -v '(PTT|DTMF|FORCE)' log | awk '{print \$4 \"\t\" \$6}' | sed 's/INACTIVE/0/g' | sed 's/ACTIVE/1/g' > log.new");
open F, "log.new";
  while (<F>) {
chomp;
($g, $h, $i, $j) = split /:/;
$g =~ tr/0-9//csd;
$h =~ tr/0-9//csd;
$i =~ tr/0-9//csd;
$j =~ tr/0-9//csd;
$date = `date -d $g:$h:$i +%s`;
$date =~ tr/0-9//csd;
if ($j eq "1") {
push @ACTIVE, $date;
}
if ($j eq "0") {
push @INACTIVE, $date;
}
}
close F;
$i = scalar(@ACTIVE);
while ($i > 0){
$A = pop (@ACTIVE);
$B = pop (@INACTIVE);
$on_time = $B - $A;
#print "A:$A\tB:$B\n";
#printf "%02.0f\n", $on_time;
$total_time = sprintf "%02.0f", abs $on_time;
push (@TOTALTIME, $total_time);
$i--;
}
foreach $time (@TOTALTIME) {
$final_time += $time;
}
printf "%s Receiver Time:\n %02.0f Sec\n %02.1f Min\n %02.2f Hrs \n", $log_date, $final_time, $final_time / 60, $final_time / 3600;