Some data analysis on 3B9C log with
JA QSOs
Here are some data analysis on the JA part of 3B9C QSO
logs.
First of all, band/
mode breakdown as usual.
|
|
SSB |
CW |
RTTY |
PSK |
FM |
SSTV |
total |
|
160 |
|
198 |
|
|
|
|
198 |
|
80 |
180 |
495 |
|
|
|
|
675 |
|
40 |
573 |
1,388 |
1 |
|
|
|
1,962 |
|
30 |
|
1,226 |
58 |
1 |
|
|
1,285 |
|
20 |
1,110 |
1,115 |
139 |
75 |
|
|
2,439 |
|
17 |
1,034 |
1,289 |
17 |
22 |
|
|
2,362 |
|
15 |
2,413 |
1,842 |
296 |
86 |
|
1 |
4,638 |
|
12 |
1,168 |
1,230 |
57 |
23 |
|
|
2,478 |
|
10 |
1,657 |
1,548 |
299 |
|
13 |
|
3,517 |
|
6 |
386 |
669 |
|
|
2 |
|
1,057 |
|
total |
8,521 |
11,000 |
867 |
207 |
15 |
1 |
20,611 |
In ‘90s, I believe the number of “ hard core” Dxers in
JA was something around 3,000. If it still remains in same range, the maximum QSO
number in each band/mode slot could be around 3,000. Looking over the slots on
SSB/CW, 40-10m, it might be around 2,000 or less, or we had not worked enough JA.
Band/mode ratio
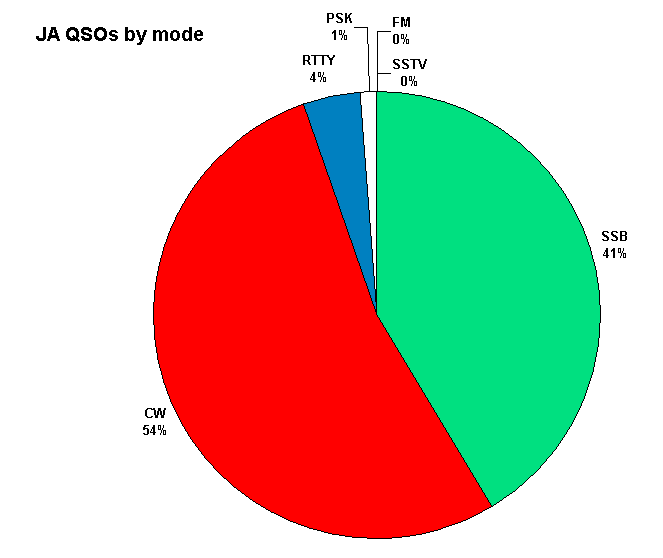
The JA mode ratios are very closed to overall mode
ratio. This means JA DXers do not have significant preference.
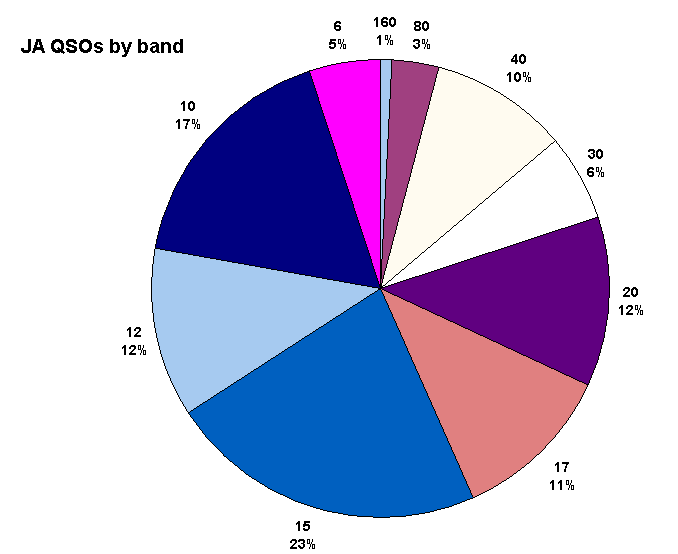
The JA band ratio chart looks similar to overall band
ratio chart. This means JA DXers prefer all band like other DXers. Note that
significant 6m portion (1% overall) is due to Kaz san’s great effort.
Daily QSOs
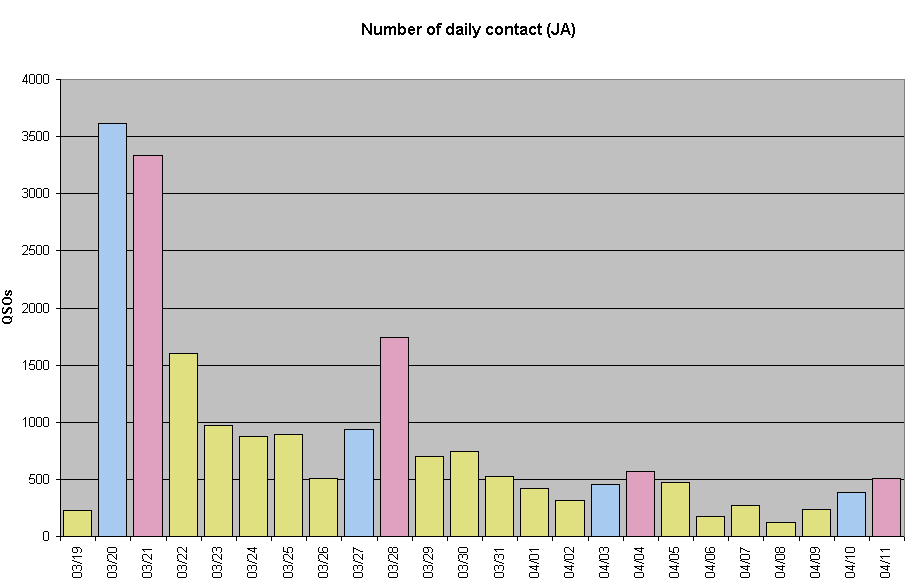
There are significant peaks in weekends (marked with
red or blue). I do not remember there is a big dump on first weekdays (Mar
22-26) on overall statistics. This indicates general Japanese lifestyle… work
on weekdays, hobby on weekends.
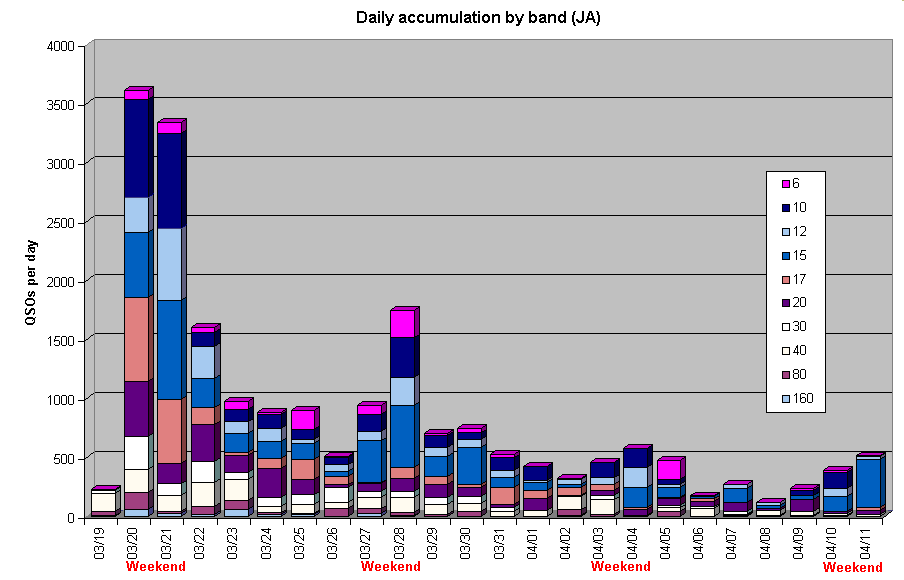
Daily band breakdown shows
that there are hard core low banders who chase DX all around the week. Low band
DXing does not interfere their working hours. Casual DXers play on higher bands
in weekends.
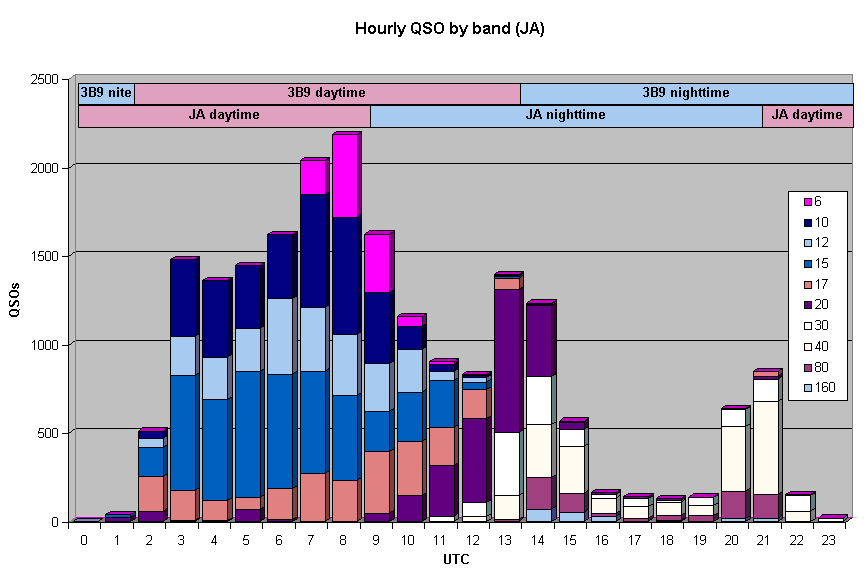
The chart by time shows the
difference of propagation very clearly. Low bands (160-40) have significant
peaks at 3B9sunset(+JA night) and JA sunrise(+3B9night). Higher bands (17-10m)
open when both ends are in sun light. 20 and 30 open just after JA sunset and
before 3B9 sunset. 6m opens around JA sunset.
Regional analysis on 6, 160 and 80m
6m

First of all, I show you the regional ratio of 6m
contacts. This indicates 6m has opened up to JA1 fairly well. No open to
northern JA (JA7,8)

This chart indicates that the number of 6m contact
simply depends on the propagation. If the propagation is not good enough, we only
work western JA (JA4-6). If our signals reach into eastern part (JA1), we get
big catches.
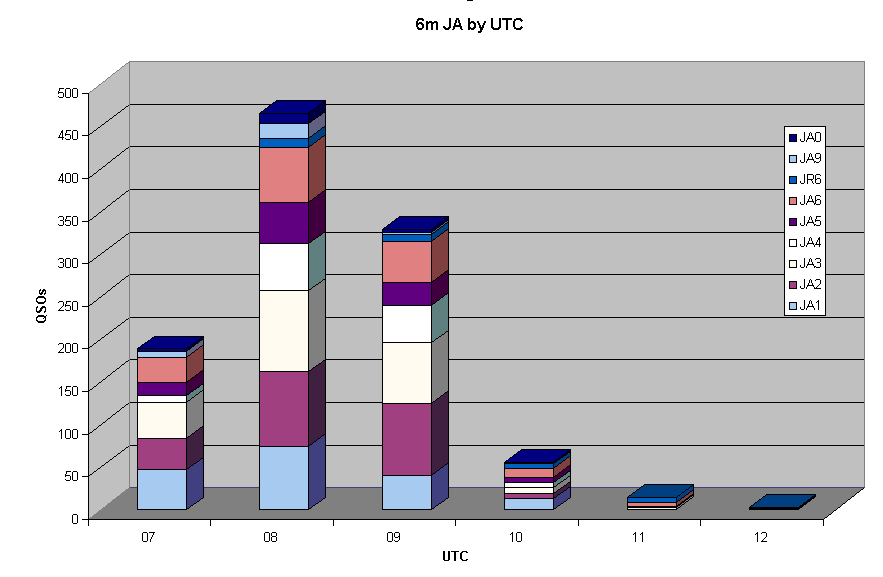
This is another slice on time axis. This shows eastern
JA had a chance between 07-10UTC, while JA6 may still have a chance until 11-12
UTC.
160m
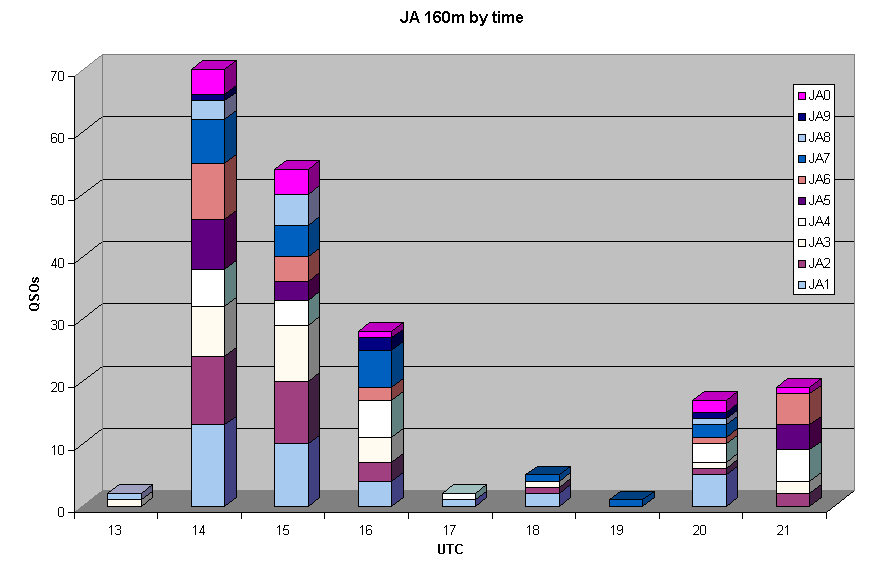
160m has a large peak at 3B9
sunset (14z). There are no significant propagation in mid night. Another peak
at JA sunrise, depending on the region. East/mid JA has a peak at 20z, while
western (JA4-6) has at 21z.

80m shows similar propagation
to 160m. Interestingly, the peak at JA
sunrise is much larger than 160m. Reason ?