All you will need
https://wxtoimgrestored.xyz/downloads/ (free)
SDR Console v3.0.23 (free)
Virtual Audio Cable (free)
Some Programs that will help
www.N2YO.com
Ham Radio Deluxe 5.24
WXtolmg Manual
G4RUJ
Weather Satellites
Setting Up
|
All you will need https://wxtoimgrestored.xyz/downloads/ (free) SDR Console v3.0.23 (free) Virtual Audio Cable (free)
|
||
|
Some Programs that will help www.N2YO.com Ham Radio Deluxe 5.24 WXtolmg Manual |
||
| NOAA - 15 137.620MHz | ||
| NOAA - 18 137.9125MHz | ||
| NOAA - 19 137.100MHz | ||
|
Satellite Pass list In WXtolmg program click on File and Satellite Pass list Satellite Dir MEL Long Local Time UTC Time Duration Freq NOAA 19 S 70E 5E 09-18 07:29:54 06:29:54 11:44 137.1000 Satellite:- Satellites Name Dir:- Direction of Satellite MEL:- Max Elevation Level (Height) Long:- Closest Longitude Pass East or West (Compass Bearing) Local Time:- Time of Pass UTC Time:- Time of Pass UTC / Zulu Duration:- How long the Satellite is visible Freq:- The Satellite Frequency |
||
|
NOAA Sensors The NOAA satellites transmit two images from different sensors. Typically, sensors 2 (near infrared) and 4 (thermal infrared) during the day, and sensors 3 (mid/thermal infrared) and 4 (thermal infrared) during the night. Sensors 1 (visible) and 2 (near infrared) are transmitted only for a short time after the launch of a new satellite. Not all enhancements apply to images containing any two sensors (for instance the MSA enhancement requires a sensor 2-4 image). Note that the Anaglyph enhancement is a 3D image requiring special red/blue glasses to view.
|
||
|
Visible imagery is just like the name
suggests; an image of the earth in visible light. This is what you would
see with your eyes if you could ride on a satellite. As you might
imagine, thicker clouds do a better job of reflecting light and appear
brighter in visible images.
|
||
|
The obvious problem with visible images is
that they are only available during the day when the sun is up. To
combat this problem, the infrared (IR) sensor was developed. It senses
radiant (heat) energy given off by the clouds. Warmer clouds which are
lower in the atmospheres give off more IR energy than colder, higher
clouds.
|
||
 |
||
|
Azimuth and Elevation are measures used to identify the position of a satellite flying overhead. Azimuth tells you what direction to face and Elevation tells you how high up in the sky to look. Both are measured in degrees. Azimuth varies from 0° to 360°. |
 |
 |
 |
 |
||
 |
 |
 |
 |
||
 |
||
 |
||
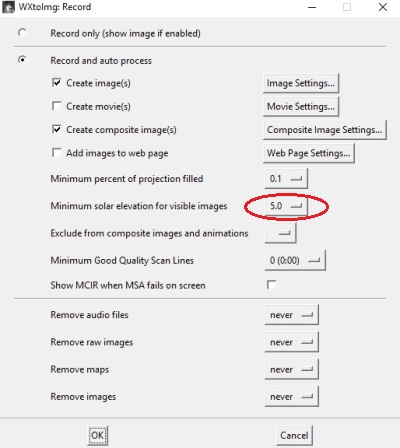
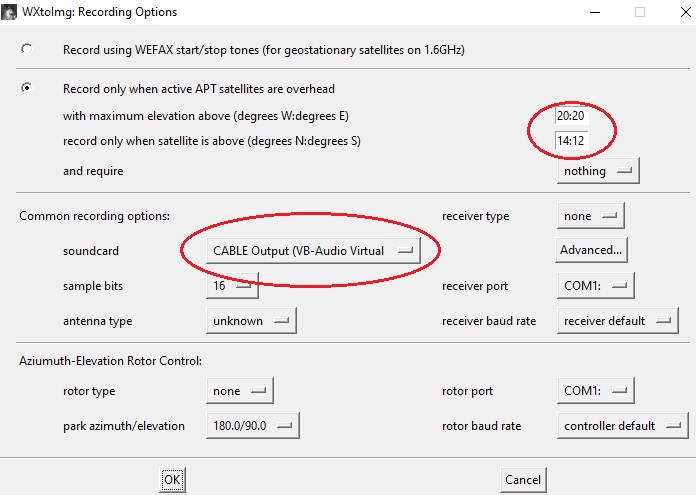
| 20:20 Will show you images 20 deg elevation East and West from you | ||
| 5:5 Will start to down load satellite images 5 deg above North, South elevation above the horizon | ||
 |
||
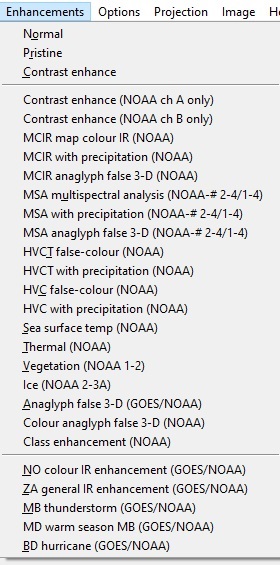
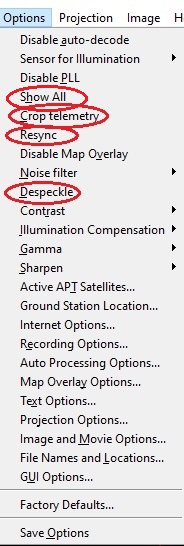
Normal Produce a normal image, using Gamma, Sharpening, Despeckling, ect settings. Pristine Produce pristine output (best representation of original digital data). Typically used to output images for further processing by other software Pristine images are unenhanced, but unlike raw images have been normalised to produce images which represent, as best as the software is able to, the original digital data. No attempt is made to temperature normalise IR images. Disables gamma, sharpening, rotation, despeckling, and other enhancements. MCIR map colour IR (NOAA) Colours the NOAA sensor 4 IR image using a map to colour the sea blue and land green. High clouds appear white, lower clouds gray or land/sea coloured, clouds generally appear lighter, but distinguishing between land/sea and low cloud may be difficult. Darker colours indicate warmer regions. MSA Multispectral analysis (NOAA-# 2-4) Multispectral analysis. Uses a NOAA channel 2-4 image and determines which regions are most likely to be cloud, land, or sea based on an analysis of the two images. Produces a vivid false-coloured image as a result. This enhancement does not use a palette nor is it temperature normalised. MSA with precipitation (NOAA-# 2-4) Same as MSA multispectral analysis, but high cold cloud tops are coloured the same as the NO enhancement to give an approximate indication of the probability and intensity of precipitation. MSA anaglyph false 3-D (NOAA-# 2-4) Same as MSA multispectral analysis, but creates a 3-D anaglyph image (must be viewed with red/blue glasses). HVCT false-colour (NOAA 2-4) Similar to HVC (below), but with blue water and with colours more indicative of land temperatures. HVCT with precipitation (NOAA 2-4) Same as HVCT false-colour, but high cold cloud tops are coloured the same as the NO enhancement to give an approximate indication of the probability and intensity of precipitation. HVC false-colour (NOAA 2-4) Creates a false colour image from NOAA APT images based on temperature using the HVC colour model. Uses the temperature derived from the sensor 4 image to select the hue and the brightness from the visible (sensor 2) image (or the sensor 4 image if the Use other sensor option is selected) to select the value and chroma. The HVC colour model attempts to ensure that different colours at the same value will appear to the eye to be the same brightness and the spacing between colours representing each degree will appear to the eye to be similar. Bright areas are completely unsaturated in this model. Sea surface temp (NOAA-# 3-4) Creates a false colour image from NOAA APT images based on sea surface temperature. Uses the sea surface temperature derived from the sensor 3 and 4 images to colour the image. No attempt is made to distinguish cloud or land from sea. The sea surface temperature may be incorrect due to the presence of thin or small clouds in the pixel evaluated, or from noise in the signal. The sea surface temperature calibration requires knowledge of the specific NOAA satellite. The temperature displayed on the status line will use the sea surface temperature algorithm to calculate the temperature only when this enhancement is used. Daylight sea surface temp (NOAA) Creates a false colour image from NOAA APT images based on sea surface temperature. Uses the sea surface temperature derived from just the sensor 4 image to colour the image. This is less accurate than the sea surface temperature derived from sensor 3-4 sea enhancement, but is available when the 3-4 image is not available. No attempt is made to distinguish cloud or land from sea. The sea surface temperature may be incorrect due to the presence of thin or small clouds in the pixel evaluated, or from noise in the signal. Vegetation (NOAA 1-2) Requires the rarely available NOAA APT sensor 1 and 2 images (seen during the test phase after satellite launch). A vegetative index is built up and this is used so that land will be coloured green, water dark blue, and clouds white. No palette is used for this enhancement and the output is not temperature normalised. Anaglyph false 3-D (GOES/NOAA) Creates a false 3-D image (must be viewed with red/blue glasses) of the visible (sensor 2) image (or the sensor 4 image if no visible image is available) by estimating cloud height. Colour anaglyph false 3-D (NOAA) Creates a false colour 3-D image based on the HVCT enhancement (must be viewed with red/blue glasses) using the visible and far-IR images of the NOAA satellite (or just the far-IR image if no visible image is available). Class enhancement (NOAA) Unsupervised classification of NOAA APT images using an iterative optimisation clustering algorithm. Uses an initial 27 cluster centres spaced equally along the two-dimensional diagonal. The classification is used to tint the histogram equalised channel A image. NO colour IR enhancement (GOES/NOAA) NOAA colour IR contrast enhancement option. Greatly increases contrast in the darker land/sea regions and colours the cold cloud tops. Allows fine detail in land and sea to be seen and provides a very readable indication of cloud top temperatures. This enhancement option is temperature normalised. ZA general IR enhancement (GOES/NOAA) NOAA general purpose meteorological IR enhancement option. Increases contrast by saturating the very low and very high temperature regions where there is typically very little information. This enhancement option is temperature normalised. MB thunderstorm (GOES/NOAA) NOAA cold cloud top enhancement option. Useful for showing where the strongest rainfall is occurring in thunderstorms. This enhancement option is temperature normalised. MD warm season MB (GOES/NOAA) The NOAA MD enhancement is a modification of the popular, general use MB enhancement scheme. It is intended for warm season use, and provides improved enhancement within the gray "step wedges" that depict "warm top" convection. An additional improvement is better delineation of warm low clouds (30C to 7C). The middle cloud range is somewhat broader than the MB, and enhancement of details is minimised. Otherwise, it is the same as the MB enhancement. This enhancement option is temperature normalised. BD hurricane (GOES/NOAA) NOAA hurricane enhancement option. Highlights certain temperatures in the eye and eye wall of the storm system which are known to be related to the intensity of the hurricane. This enhancement option is temperature normalised. |
Screen shot from SDR Console
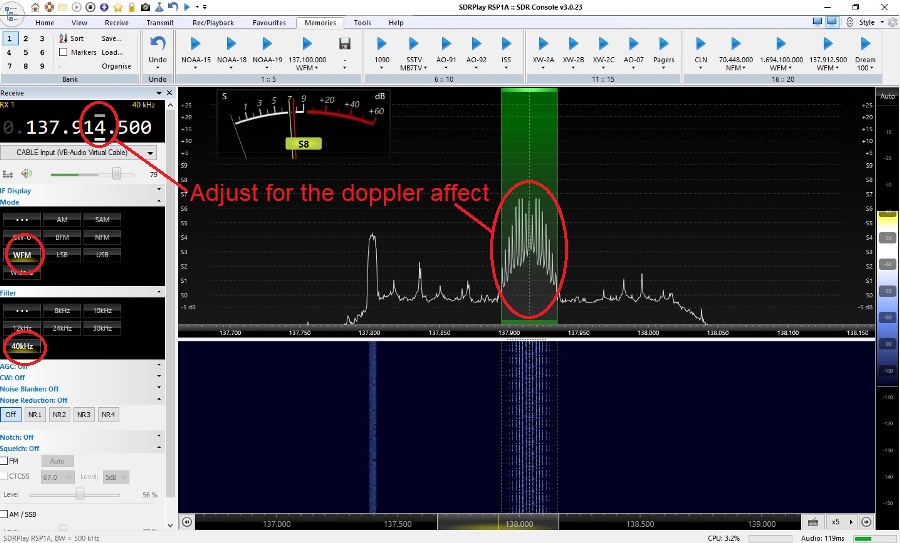
| This is a screen shot from my SDR Console Note that the satellite frequency of the satellite varies with the Doppler affect by about 3Hz each way and this needs to be adjusted. Also make sure that the SDR settings are correct WFM and 40KHz x |
||
WXtolmg Program

| This is a screen shot from the WXtolmg program. Once this is finished then click on the Enhancements tag at the top to view all the images. x |
||
Page Updated 17/01/2025