Spect16 - FFT Spectrometer


A radio astronomy FFT Spectrometer - Back-end
100MHz of spectrum with up to 8192 channels on a Single board.

In radio astronomy spectrometers, operating in the microwaves to millimeter-waves and sub-millimeter-waves, are used to detect and to measure molecular lines such as in star forming regions, cometary and planetary atmospheres etc.
On the lower microwave bands the bandwidths required are only a few MHz wide with line widths of a few KHz, but as we go higher in frequency wider bandwidths are required and the spectral lines observed are broader. Interesting spectrometry experiments can use as low as 20MHz of bandwidth to several GHz of bandwidth depending on the frequency region and specific observation interests.
Most, if not all, molecular line observations up to 30GHz can be done using less than 100MHz bandwidth for which this spectrometer can be used.

Inside the Spect16 - FFT Spectrometer.

Fourier spectroscopy involves four operations. (1)Sampling the intermediate frequency signal at high resolution, (2)computing a Fourier transform of each windowed data section, (3)squaring the magnitude of the Fourier data and (4)averaging the spectra.

The first step requires digital samplers (A/D converters) with high sampling rate and stability. The second step is very demanding and constitute the actual bottle neck of any FFT spectrometer design since a Fourier transform must be happening at the same rate as the acquired data thus requiring large FFT's to be fully computed in few microseconds. The third and fourth step are quite demanding in the amount of logic and fast memory required but have a low design complexity.

The number of computations per second involved in broadband FFT spectrometry is enormous if combined with the requirement that sampling and computations must be continuous without any losses of data for reasons of sensitivity. The speed of the data flowing and the absence of any extra time to compute the FFT dictates the usage of sequential pipelined FFT algorithms that differ considerably from the canonical FFT implementation of text books.
The implementation in hardware can become considerably extense and logic resources can only be provided by large programmable gate arrays.


Picture shows the actual implementation
of the Spect16 - FFT Spectrometer.


Interfacing to the Intermediate Frequency.

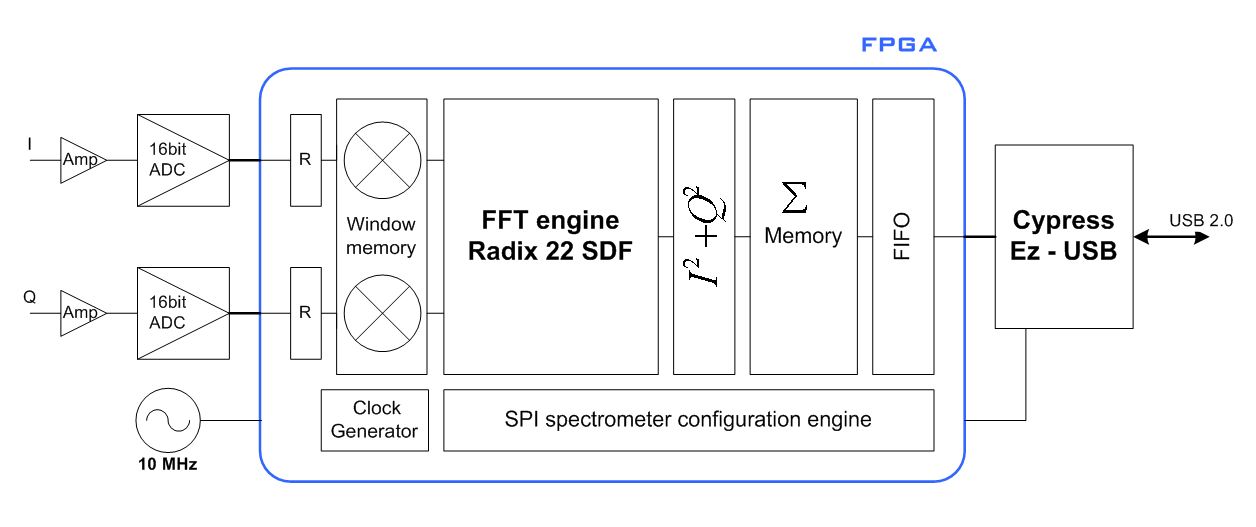
Single ended IF configuration using just one ADC input (or both in parallel) is possible and spectrometry uses only the positive side of the spectrum. This configuration is the simple but uses only half of the bandwidth available, it allows however a quick connection to any existing radio telescope setup.

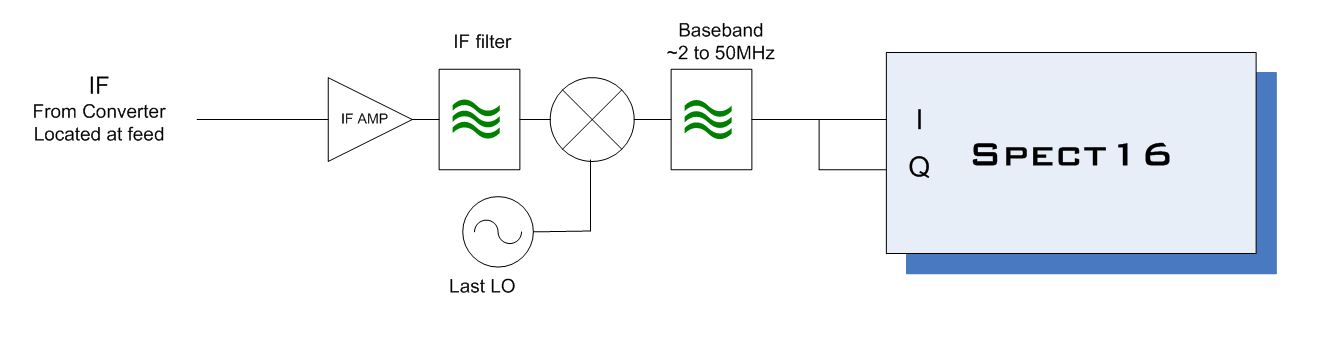
Complex IF signals can be used where ADC signals came from an I,Q IF converter. This will be using the full bandwidth. In this configuration the bandwidth measured is equal to the sampling frequency.

Low pass filters are of great importance to let only pass the desired bandwidth and should be designed to suit the specific the sampling rate. Note that different FPGA cores may have various sampling frequencies and therefore different filters would be required.

As the ADC have enough bandwith (500MHz) on their input it can be used also in a under-sampling mode where the input frequency range is criteriously 
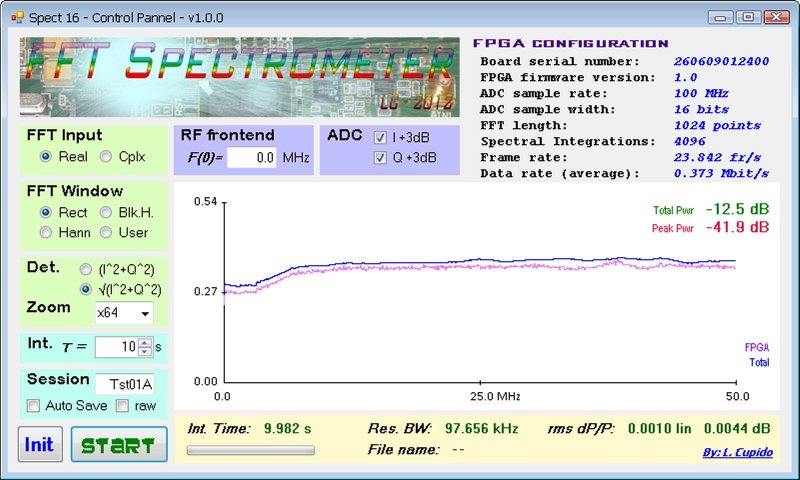
placed in any band segment above the sampling frequency. For a 100Ms/s sampling frequency and the spectrometer being used in real mode (while using a 2MHz margin at both sides) it can be used for the following segments 2-48MHz (base-band), 52-98MHz, 102-148MHz, 152-198MHz, 202-248MHz, 252-298MHz, 302-348MHz, 352-398MHz, etc. The same can be done in complex mode therefore using the segments -98+98MHz (base-band), 52-148MHz, 152-248MHz, 252-348MHz etc.
This were just examples to illustrate the under-samplig usage.


Spectrometer configuration for real mode IF.
Covering about 48MHz (for a 100Ms/s configuration).
LO placed below the IF lower band edge.


Spectrometer configuration for complex mode IF.
Covering 100MHz (for a 100Ms/s configuration).
LO placed at the IF center frequency.


A full featured control panel on the PC.

A control panel application serves the purpose of controlling and configuring the Spectrometer and monitoring its operation. It is not intended do do any signal processing as that is expected to be done on any specialized software package such MatLab, IDL, Octave or else.

This control application allow the user monitor the acquired spectra and to save integrated spectra at any configurable rate and also allows to save the complete raw data from the spectrometer.

Since there are fundamental differences in the logic implemented inside the FPGA for the various FFT parameters and spectral integrations, as these variations are not simple run time parameter changes one could select in software, complete builds of the FPGA configuration are required. Many of these configurations are ready made and tested therefore there is a collection of configurations that span from 1024 FFT points to 8192 FFT poitns along with spectral integrations that provide always more than 10 frames per second arriving to the PC. FPGA Configurations with variations on the sampling frequency number of points integrations etc. can be downloaded to the FPGA. This is however done using the download tool from Altera (which is free and easy to use).

There are no specific requirements on the PC performance since all the Fourier transforms and demanding part of the spectral integration happens inside the FPGA. However the amount of data transferred for some FPGA configurations and subsequent integrations on the PC may still require a PC with reasonable performance.


Spect16-Control panel Software application
Running on a PC.
Example of FPGA configured for 100Ms/s and 1024 points.


Any comments: Luis Cupido