Receiving the deep space spacecrafts.
The 8.4GHz band may be quite an interesting band
to make some RX experiments of very far away signals not just for
the pleasure of receiving very far away transmissions but also for
the challange of making a very low noise and stable receiver at microwave
frequencies. Some hardware for DSN rx can be found here on my Microwave Experiments pages. |
Converter assembly at the antenna focal point. ![]() |
Cassini
The signal was marginal on a water-fall spectrogram but clearly measurable with just one minute integration time. |
Signal spectum with doppler corrected 10 minute integration time. Identification of the Cassini signal was based on the fact that signal has the right doppler variation as predicted by the relative velocity calculation (19Hz). Signal is 4.9 dB [Hz] above noise. |
Voyager 1
To detect this signal that is expected to be 13dB/Hz below the noise floor I had to aquire and integrate spectrograms for a long time. I did several aquisition periods of 15 minutes (900s) the minimum I would expect to see something. More than 15min in each chunk is also undesirable because of the doppler change correction scheme used. The receiver is operated at fixed frequency and the doppler variation was corrected by skewing sucessive spectrograms in software while accumulating. Positive identification of the V1 signal arises from the fact that signal is only visible for the right skew ammount that corresponds to the doppler variation as predicted by the relative velocity calculation. |
Combining four of the best integrated spectrograms, we could obtain this
1 hour (3600s) integrated spectrum where all the other peaks nearly disapear.
The blue trace, being the best one, has about 0.2dB of (S+N)/N that corresponds to
-13.3dB of S/N [4Hz] or -7.2 dB [Hz] (Using 1.3Hz resolution we could see that my
rx signal was spread over 4Hz). |
Although I'm confident in the data presented above, with such small
signals and this long integration times there is a possibility of this to be
some kind of artifact, however it seems unlikely as it has the exact doppler
change signature expected and appears in repeated acquisitions.
The data corresponding to 03:45-04:00utc, the blue trace,
is here v103450400.wav (38Mb) for you to play.
More you need to know that at 03:45 the 'deldot' was -1.8709388 and
at 04:00 the 'deldot' was -1.8455499 Km/s, and this corresponds to
a frequency drift of -713.11 Hz that you need to compensate
while doing the spectral integration.
Independent data analysis
by James Miller - G3RUHAnd yet another independent data analysis
by Yoshi Takeyasu - JA6XKQ
The Lunar Prospector. 
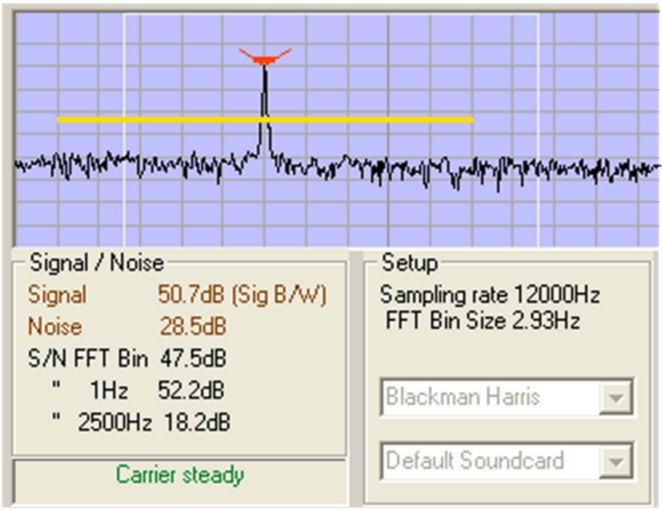
Lunar Prospector was received on the 18 Jan.1998. The main carrier on 2273.0 MHz +/- dopler was about 10 dB above noise [on a 2.3kHz bandwidth]. Subcarrier was marginal to 4 dB above noise on 2274.02 MHz +/- dopler [also on a 2.3KHz bandwidth]. An occultation was observed on 18 January, at 01:40 utc (aprox.time) lasting for about 47 minutes as predicted by NASA Mission Status Report #10. 
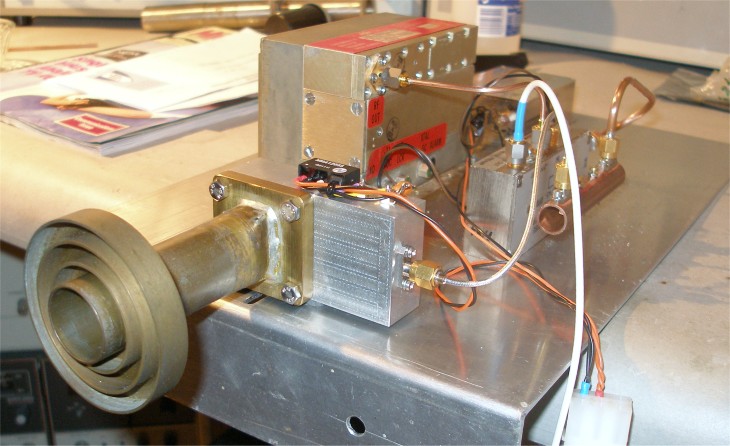
Equipment used on this experiment was: Antena 5.6m dish underiluminated (down to 4m) by a LHCP helix feed. Home built converter (DMK's Ham Sat SMode Converter modified to 2273 MHz) located at feed point, NF was 0.9 dB aprox. (1st device MGF1303). First IF used was at 192.8 MHz followed by a second conversion to 28.0 MHz (using a R&S signal generator on 164.8 MHz as the LO). The demodulating final rig was a Kenwood TS850. |
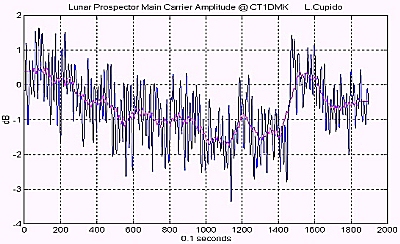
Amplitude variation on the Main Carrier.( The fast (apx. 1 sec.) and slow (apx. 20 sec.) fadings are due to spin movements of the spacecraft. An antena aiming correction was done at about second 143) |
Any comments:
Luis Cupido