Solar activity and HF/VHF propagation page
CO8TW
Information about radio propagation on HF and VHF for Hams and SWL.
(This page
will automatically update every 15 minutes.)
___________________________________________________________________________________________________
https://helioforecast.space/solarcycle
https://www.solarham.com/progression.htm
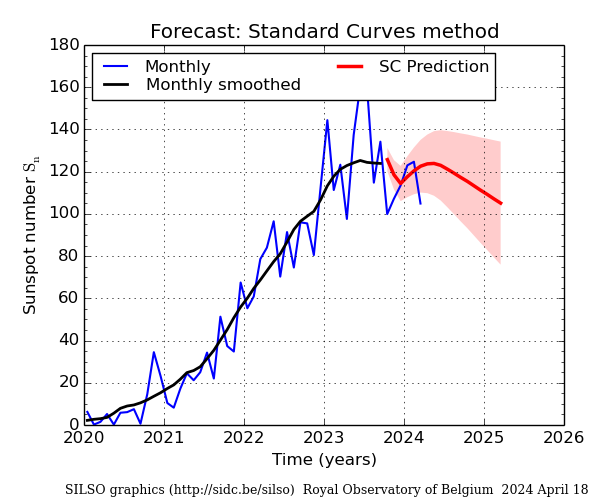
Progression of solar cycle.
Understanding HF Propagation VE2XIP PDF document.(694 kbyte)
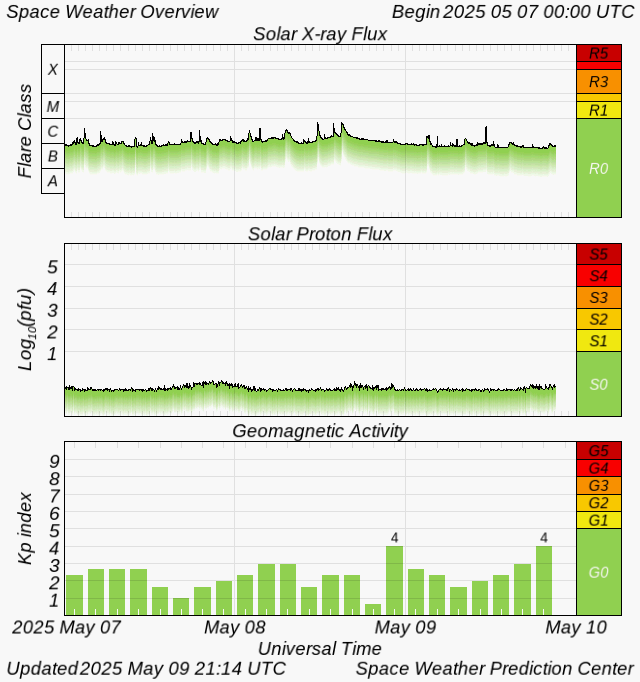
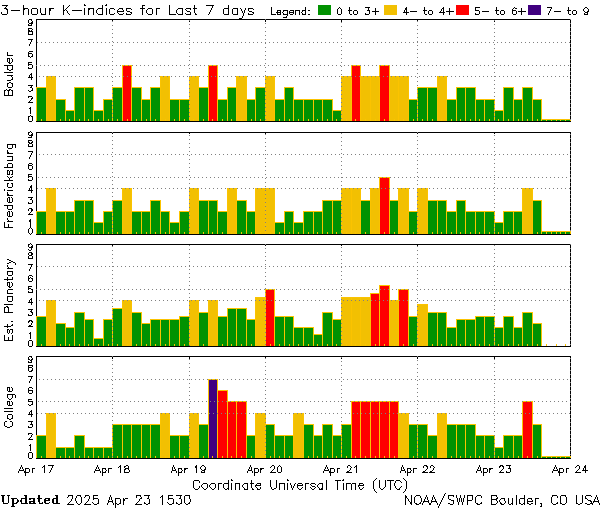
At 18 minutes past the hour, radio stations WWV and WWVH broadcast the latest solar flux number, the average planetary A-Index and the latest mid latitude K-Index. In addition, they broadcast a descriptive account of the condition of the geomagnetic field and a forecast for the next three hours. You should keep in mind that the A-Index is a description of what happened yesterday. Strictly speaking, the K-Index is valid only for mid latitudes.
http://www.swpc.noaa.gov/products/3-day-forecast
3 day forecast.
http://spawx.nwra.com/spawx/list27do.html
Predicted Sunspot Numbers and Radio Flux for next 27 days.
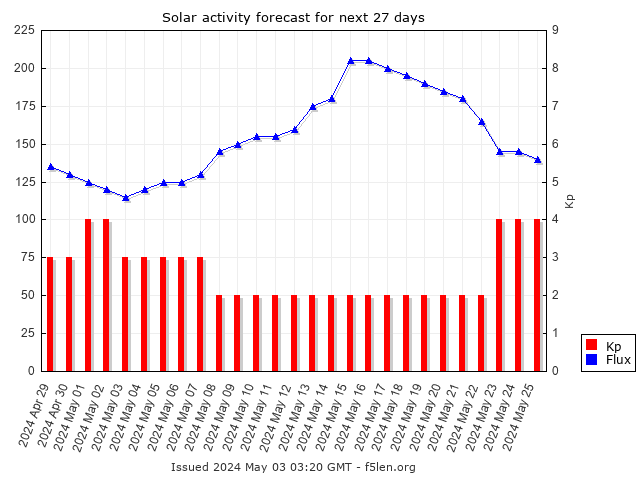
http://cluster.f5len.org/sun/27do.png
Solar activity forecast for next 27 days..
http://cluster.f5len.org/sun/dsd.png
Last 30 days daily solar data.
ftp://ftp.swpc.noaa.gov/pub/weekly/RecentIndices.txt
Recent Solar Indices of Observed Monthly
Mean Values.
http://cluster.f5len.org/index.php?p=forecast
Propagation forecast.
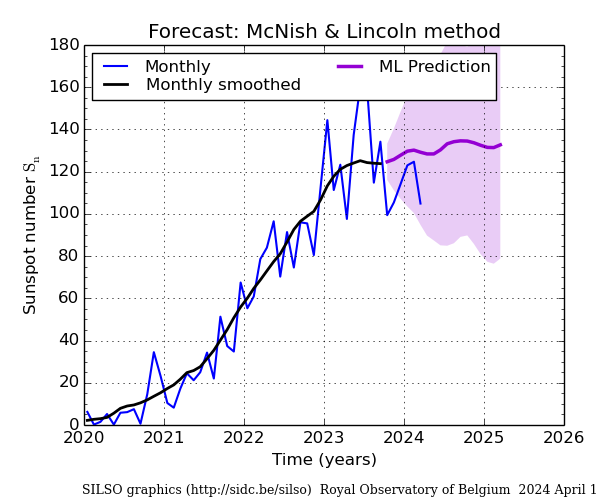
Solar Cycle Progression
https://www.swpc.noaa.gov/products/solar-cycle-progression
https://www.solarham.com/progression.htm
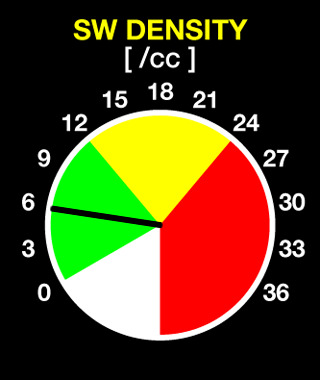
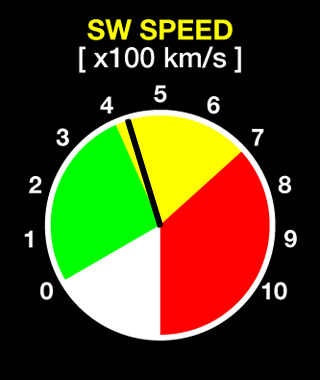
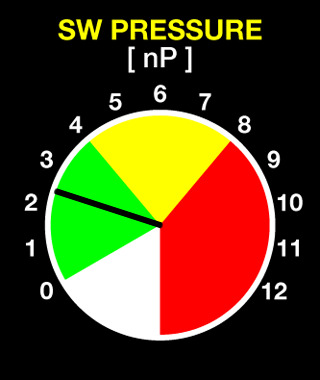
| Solar wind | |||
 |
 |
 |
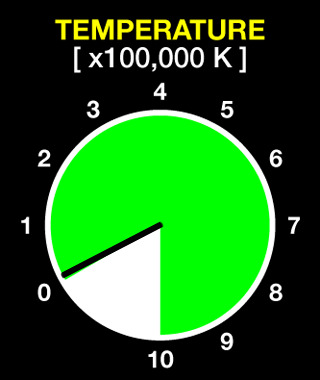 |
| Interplanetary magnetic field (IMF) and potential in the solar ionosphere | |||
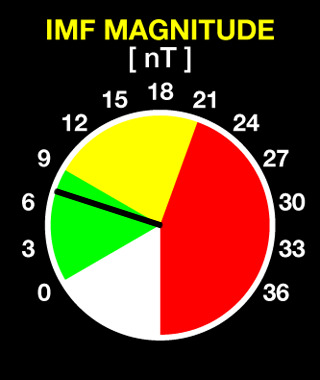 |
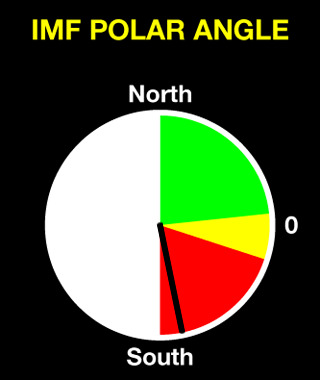 |
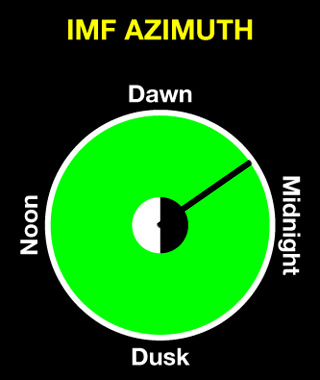 |
 |
https://www.swpc.noaa.gov/products/
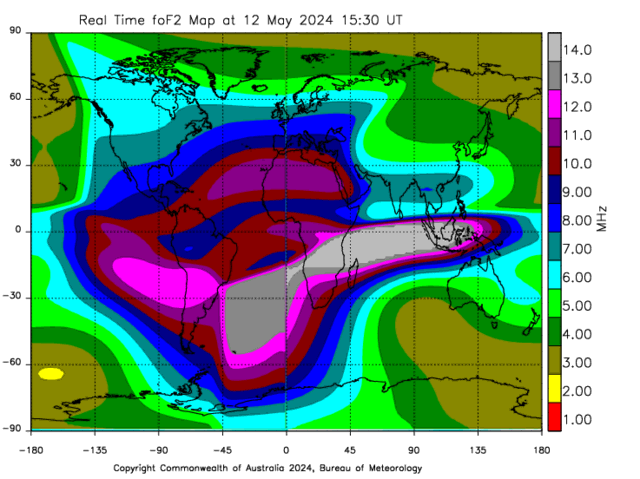
In cases where the incidence of the radio wave on the ionosphere is vertical or nearly vertical (NVIS), this wave will be reflected by the F2 layer as long as its frequency is below a value known as the critical frequency or F2 cutoff frequency (foF2), which can be measured with ionosondes. The map is experimental and is constructed from ionosonde data from Australia, Japan, South Africa, Italy, Argentina, and the United States.
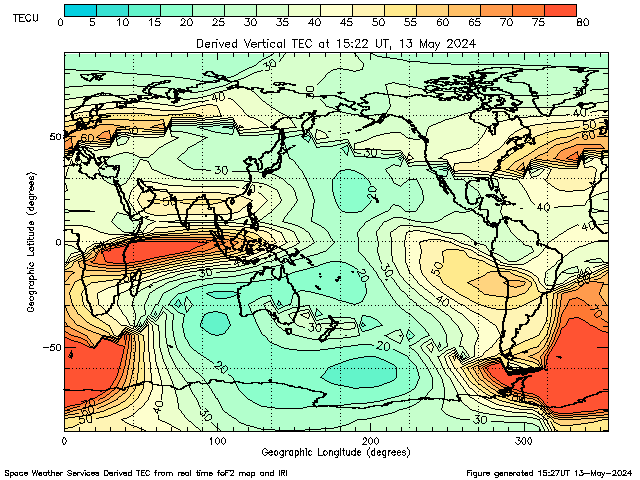
Total Electron Content (TEC) gives an idea of the degree of ionization in the ionosphere. Its unit of measurement is the TECU (1 TECU = 10¹⁶ electrons per square meter). Areas with higher TEC indicate the occurrence of ionization phenomena of different origins: photoionization, absorption, etc.
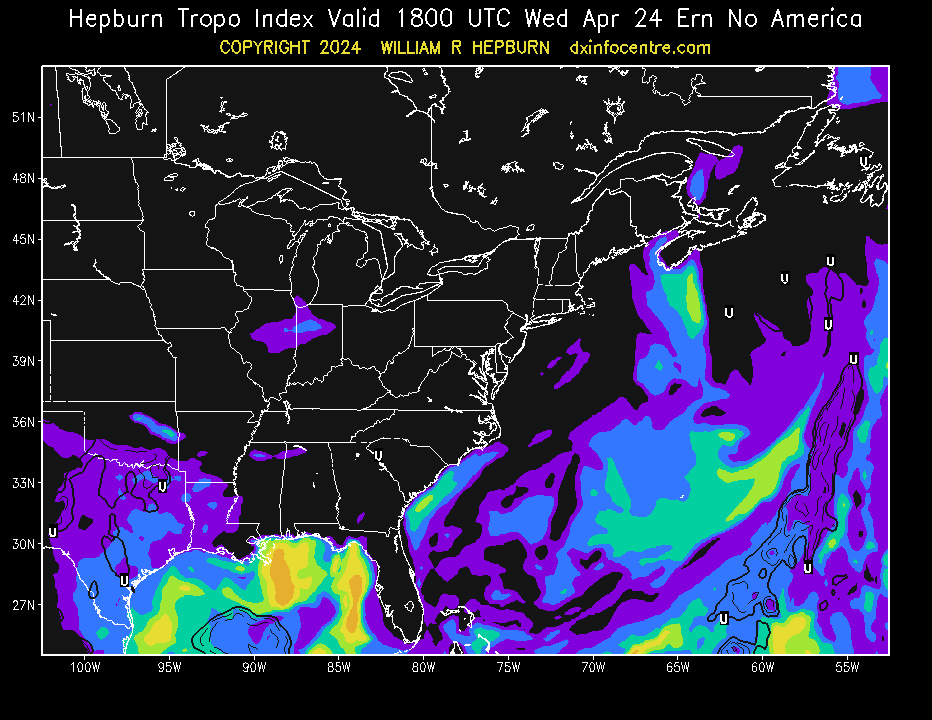
The areas noted in the forecast have the necessary atmospheric conditions to produce tropospheric bending of VHF, UHF and/or microwave radio waves. Tropospheric bending extends the range of radio & TV stations well beyond their normal limit and thus increases interference amongst stations as well.
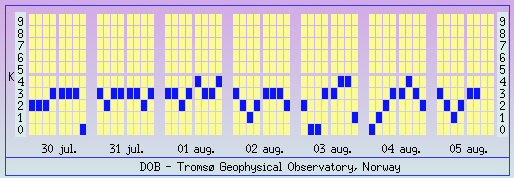
K index.
27 day solar predictions .
https://helioforecast.space/static/sync/predstorm_real.txt (From https://helioforecast.space/solarwind)
1 hour time resolution. Updated every 30 minutes. The data shown in the plots are available
in ASCII format in a 1 hour
time resolution
Currently, this forecast only works
for high-speed solar wind streams, and will fail during
times when solar storms, also known as coronal mass ejections, impact the Earth's
magnetic field
Current solar images.
____________________________________________________________________________________________________________
Putting
it all together
* Higher solar flux levels are generally good for HF
* High K and A indices are generally
bad – result in absorption and breakdown of the F region.
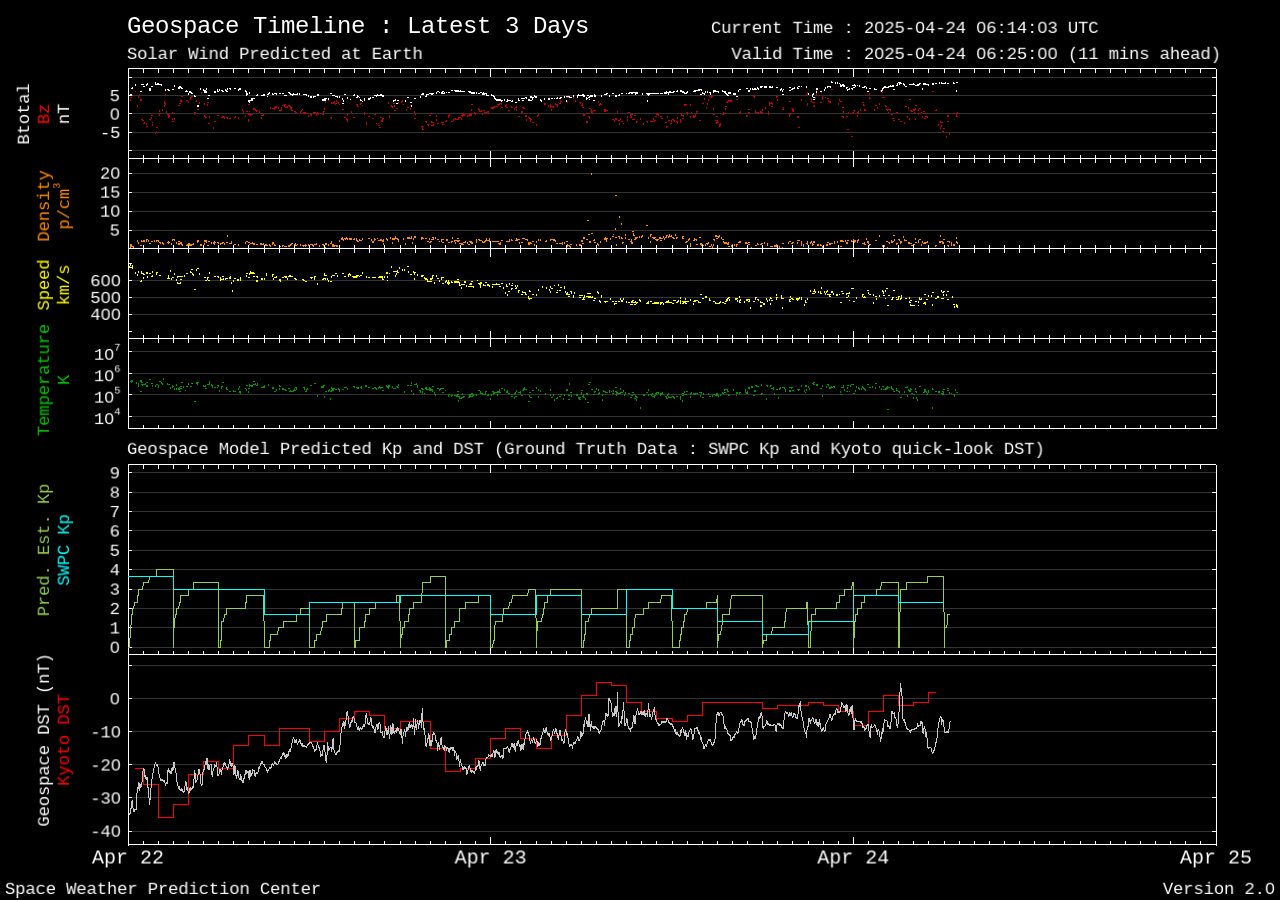
* Solar Flux / K index / Solar wind
speed and Bz will give you
a real-time indication of what bands you
should concentrate on.
* Bz going south(-) and an increased solar wind speed (450km/s+) are generally bad news for
HF.
* If your signals follow a polar path that cuts
through the auroral zone(s) and the K index is high
you will have problems.
* Spring/Autumn/Winter are better
than Summer as the ionosphere is cooler,
denser and MUF is higher during the
day. Ionic composition is different in Winter too. But night
time MUFs are higher in summer.
* The opposite is true in the southern hemisphere.
* Spring/Autumn good for trans-equatorial contacts.
* As the sun gets higher D layer
absorption grows, but the MUF rises,
so follow the MUF up during the day
and down at night.
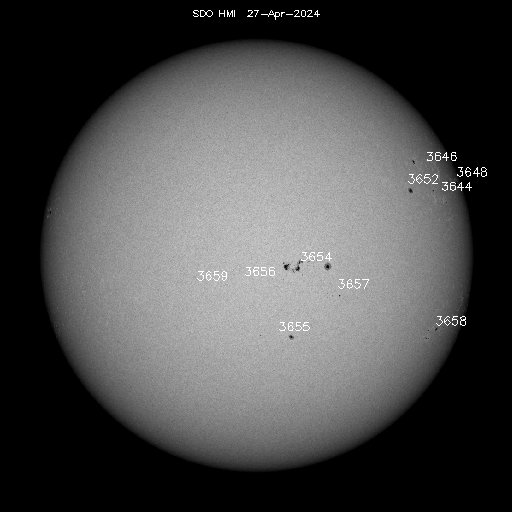
* The
center of the visible solar
disk is the region that has maximum effect on Earth.
Flares.
* Check the higher bands
for openings for several hours
following a solar flare, or a ten-flare event, due to
the enhanced E/F layer ionization, possibly temporarily raising the MUF.
* If you’re in a QSO when a major flare
causes an HF blackout, it seldom lasts
more than an hour. If you’re
working a contest, this hint could
be useful. Take a break, but don’t QRT!
* X-rays do provide extra ionization to the
E/F layers for improved reflectivity and a higher MUF. Exploit the benefits of
a solar flare.
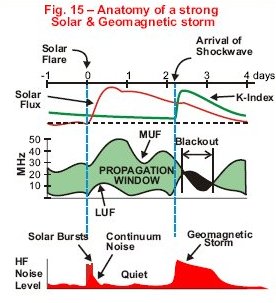
* The most damaging effects of a solar flare is actually the
arrival of the shockwave 2-3 days later, triggering
a geomagnetic storm.
* Often our magnetic field gets very quiet
following a strong geomagnetic storm for 12–24 hours. This is an
excellent time to work 40–160M due to very low
noise levels.
* Use the current K-Index from WWV or the internet to determine the current geomagnetic conditions. The A-Index is actually
yesterday’s geomagnetic condition, and does not represent present
conditions.
* As soon as the solar storm ceases, HF noise levels become
quiet with an elevated MUF, lasting until sundown.
Night time conditions on 80-40M can be excellent. The daytime MUF the next day
may be elevated as well.
* when the geomagnetic storm subsides. Night time noise levels on
40-80M can be very low.
* The x-rays from flares (class
M5.0 or larger) can be
intense enough to have a considerable impact on ionospheric radio communications. In some cases, the absorption can be strong enough to
completely blackout all radio communications between points more than 3,000 to 4,000 km up to frequencies as high as 10 MHz for a period of between
15 to 30 minutes. Minor absorption can maintain weaker than normal signal strengths for an additional
20 to 30 minutes. These types of major
flares are much less frequent than
minor M-class flares.
____________________________________________________________________________________________________________
Grey line map - One (click here)
Near real time MUF map.
The following map shows Maximum
Usable Frequencies (MUFs)
for 3000 kilometer radio signal paths. The
map was developed by Andrew Rodland (KC2G) through an open-source project
available on GitHub, which was presented at the HamSCI 2021 conference, using
data from NOAA NCEI and GIRO. The circled numbers represent the MUF(3000)
calculated directly by the corresponding ionospheric sounding stations. Based on
this data, the MUF(3000) map is extrapolated for the remaining locations. To
determine the MUF of a link from the map:
3000 km TRAJECTORIES: Estimate the midpoint of the trace and find the
corresponding frequency using the color scale.
4000 km TRAJECTORIES: Estimate the midpoint of the trace, find the corresponding
frequency using the color scale, and multiply its value by 1.1.
ROUTES LONGER THAN 4000 km: Divide the route into equal segments of 3000 km or
4000 km (choose the alternative that best fits). Take the two extreme segments
of the route and calculate the MUF of each, using the methods described above.
The MUF of the entire route will be the smaller of the two MUFs calculated.

____________________________________________________________________________________________________________
If the radio
wave reaches the ionosphere following a vertical o
near vertical path (NVIS),
reflection will occur in the F2 layer only if
the frequency of operation is
below a threshold
known as F2 layer critical or cut
frequency (foF2), which can
be measured using ionosondes.
The following experimental maps are built using data from ionosondes located in Australia, Japan, South Africa, Italy, Argentina and the United States.
https://www.sws.bom.gov.au/HF_Systems/6/5
____________________________________________________________________________________________________________
The Total Electron
Content (TEC) gives an idea
about the ionization grade of
the ionosphere. Its unit of
measurement is the TECU (1 TECU = 10E+16 electrons
per square meter). The zones with the
highest TEC are affected by the occurence
of different ionization phenomena, such as photoionization, absorption, etc.
https://www.sws.bom.gov.au/Images/Satellite/Total
Electron Content/Regional Maps/World_tec.gif
____________________________________________________________________________________________________________
Predicted Sunspot Number And Radio Flux ...
https://www.swpc.noaa.gov/products/predicted-sunspot-number-and-radio-flux
____________________________________________________________________________________________________________
Click to see 400 year
of sunspot observation.
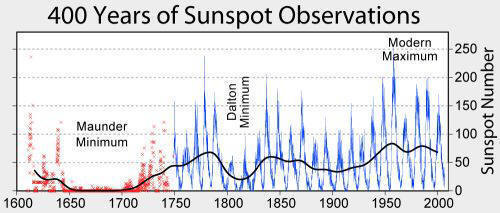
Click to get an Azimutal map.
_________________________________________________________________________________________________________________________
Also you most to see.
e-mail: CO8TW
e-mail address