Phase Noise
Analyzer - Sampling Frequency vs Spurs
From
the classic sampling theory (or digital signal processing), the spurs are theatrically
existed. Analysis will be presented here. Matlab
scripts
have been written to complete some simple simulations. It is not a rigorous
script, but match the test results well.
Examples
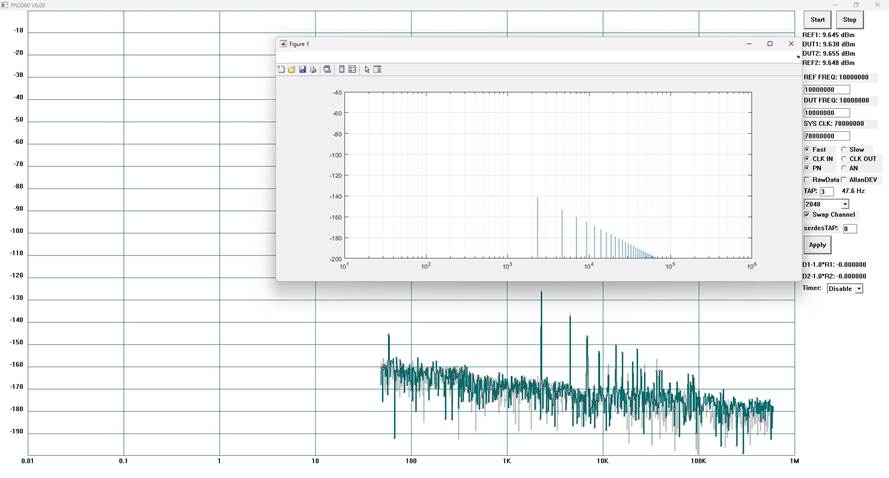
are presented firstly. Test setup: all 4 ports are feeded with a same 10MHz
signal (for self-correlation). Let Fs=78MHz and f_DUT=9.99994MHz, the following
figure shows the test result along with the simulation result. It is
interesting that if the Fs is exactly 78MHz (without deviation) and f_DUT is
exactly 10MHz, there are no spurs in the interested frequency range (<1MHz).
However, in a real environment, there are always some deviations for the Fs and
the DUT as the temperature stability of the DUT & sampling clock is
limited.
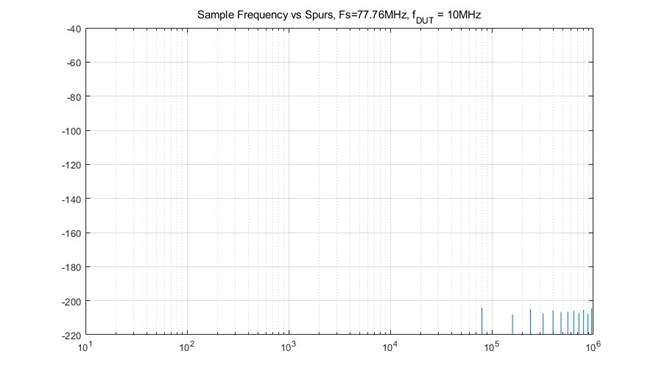
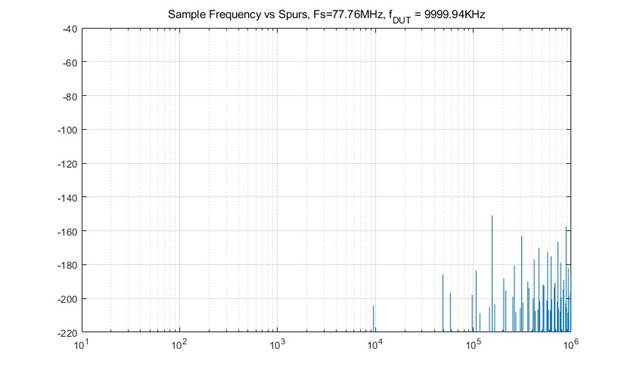
And
following is another example, where Fs is exactly 77.76MHz and f_DUT is exactly
10MHz. It seems that the amplitude of the spurs is well below the noise floor
of the device, which is not detectable. However, if f_DUT=9999.94KHz (60Hz
deviation), there will be many large spurs again.
Possible
solutions: Calculating
the spurs and removing them dynamically (including follow the deviation). These
algorithms can be implemented based on matlab scripts.
END