Sony XDR-F1HD Seeeduino Modification
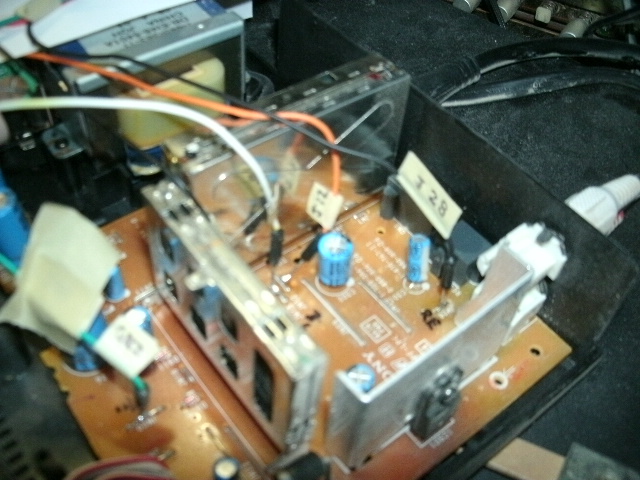 early fuzzy photo of my Sony-Seeeduino setup
(jumpers were later bundled and exited thru a drilled hole in the rear apron)
early fuzzy photo of my Sony-Seeeduino setup
(jumpers were later bundled and exited thru a drilled hole in the rear apron) This graph was obtained by using the "S" option numeric data dump at 100-kHz intervals with the numbers entered into Lotus Works Chart Maker and the two (88-98 MHz and 98-108 MHz) graphs
being joined and calls added with PSP4 - an admittedly-arduous process not likely repeated.
This graph was obtained by using the "S" option numeric data dump at 100-kHz intervals with the numbers entered into Lotus Works Chart Maker and the two (88-98 MHz and 98-108 MHz) graphs
being joined and calls added with PSP4 - an admittedly-arduous process not likely repeated.
After the graphic interface was implemented (again, more extensive there now than when I did it in Sept 2012) some of these initial results were obtained (the saved png images, with date stamp dd-mm-yyyy, were modified in PSP4, with the calls and freqs being added)
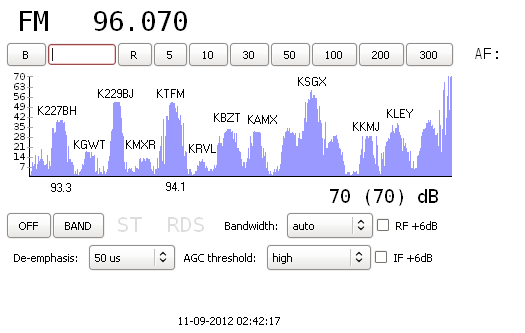
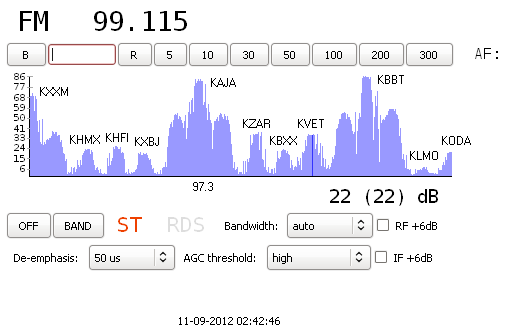
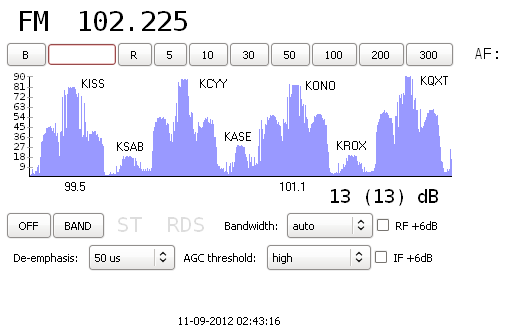
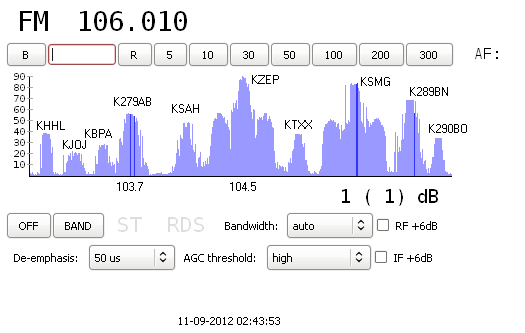
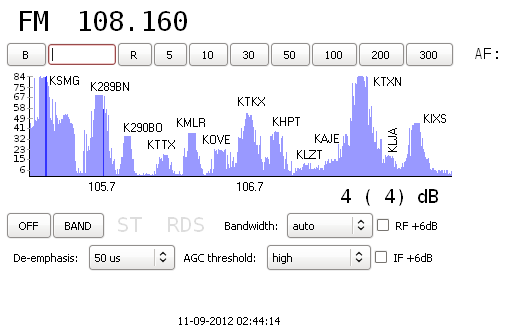 On each set of these graphs the IBOC (HD) "sidebands" of the locals are very evident.
98-108 MHz scan Sept-08-2012 - 1914 CST (the dynamic vertical scale continually adjusts to just fit in the max signal level on the display)
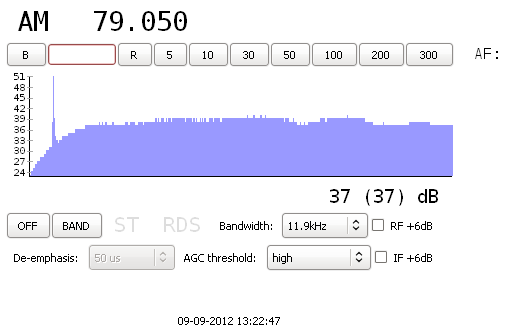 scan showing part of ATSC (DTV) KCWX-DT-5 (76-82 MHz) with prominent pilot at 76.310
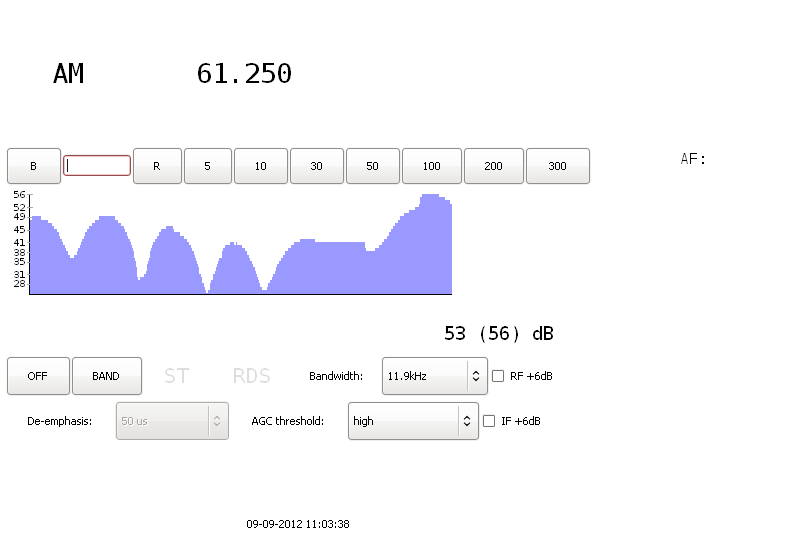 showing fading effects (mostly due to aircraft)
on XHPN-3's 61.250 NTSC video carrier
showing fading effects (mostly due to aircraft)
on XHPN-3's 61.250 NTSC video carrier
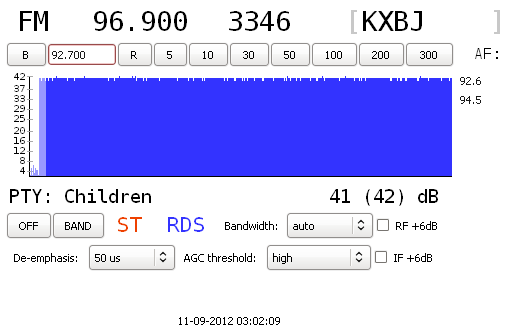 RDS decoding on KXBJ 96.9
(European PTY set so not matching US system)
RDS decoding on KXBJ 96.9
(European PTY set so not matching US system)
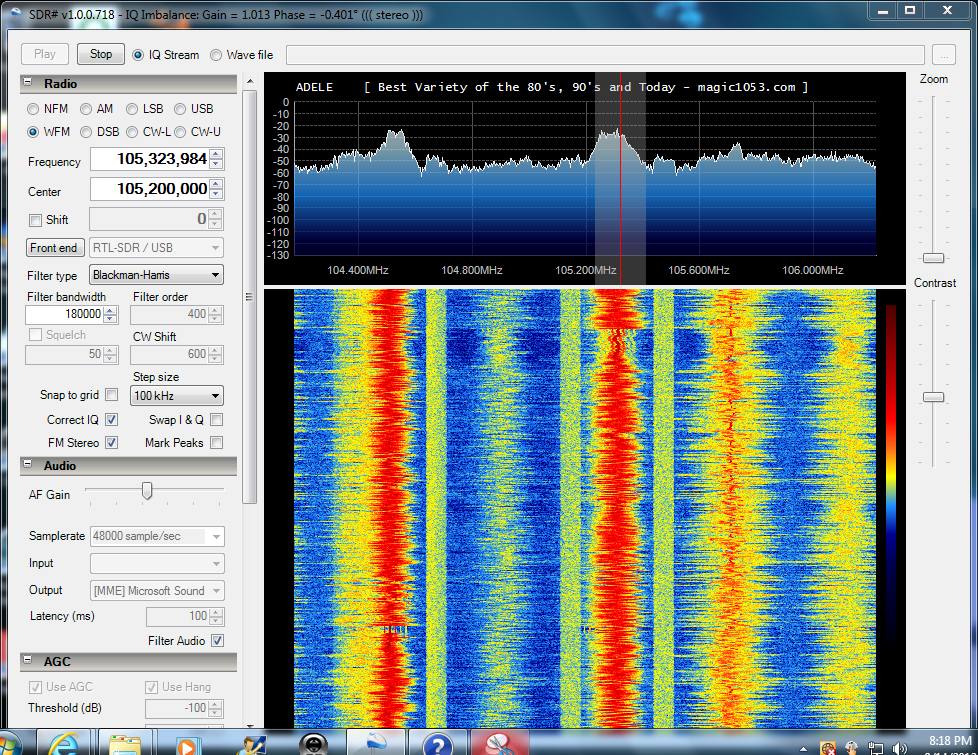 SDR# display centered on local 105.3 MHz - 09-14-2012 - 2018 CST
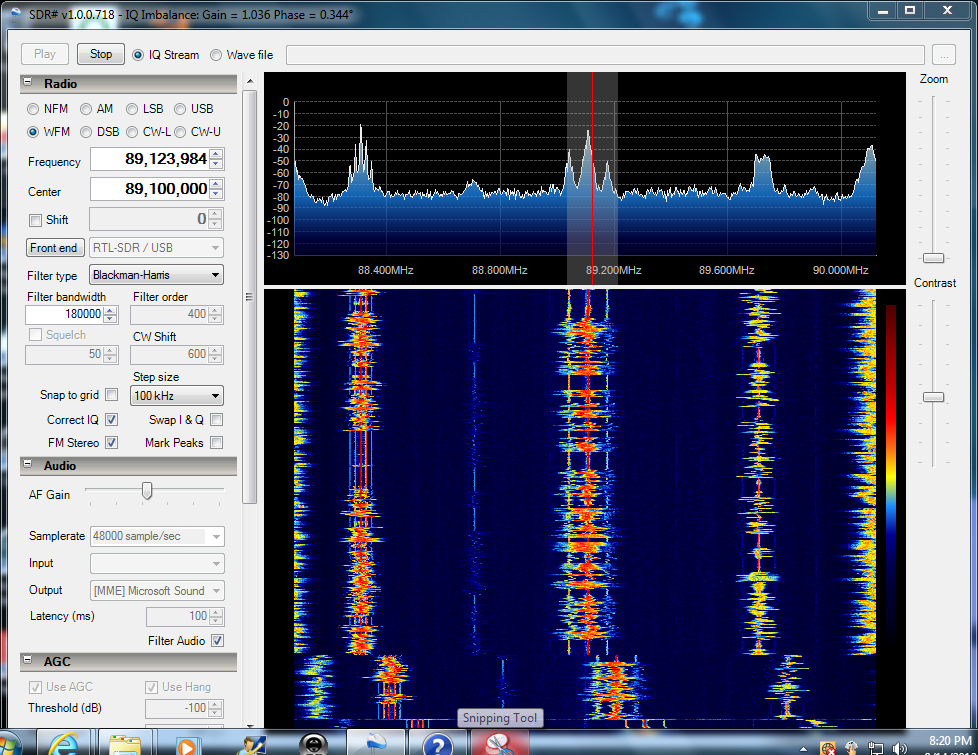 SDR# display centered on local 89.1 MHz - 09-14-2012 - 2020 CST
(those are SCA sidebands on it and 88.3)
SDR# display centered on local 89.1 MHz - 09-14-2012 - 2020 CST
(those are SCA sidebands on it and 88.3)
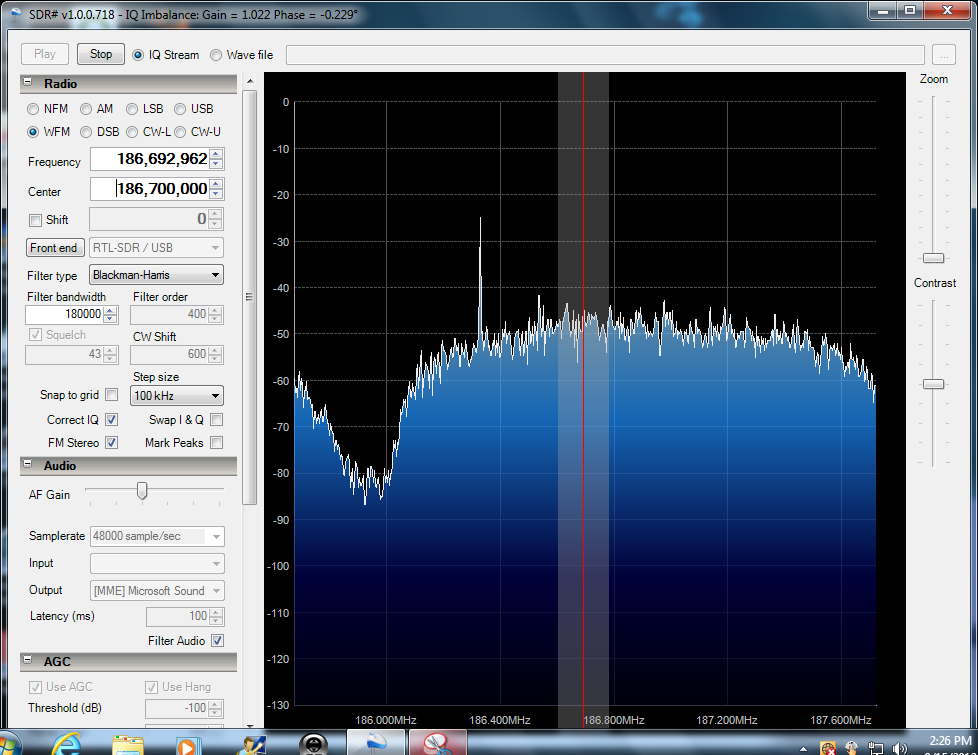 SDR# display showing KLRN-DT-9 pilot (186.310 MHz) - 09-15-2012 - 1426 CST
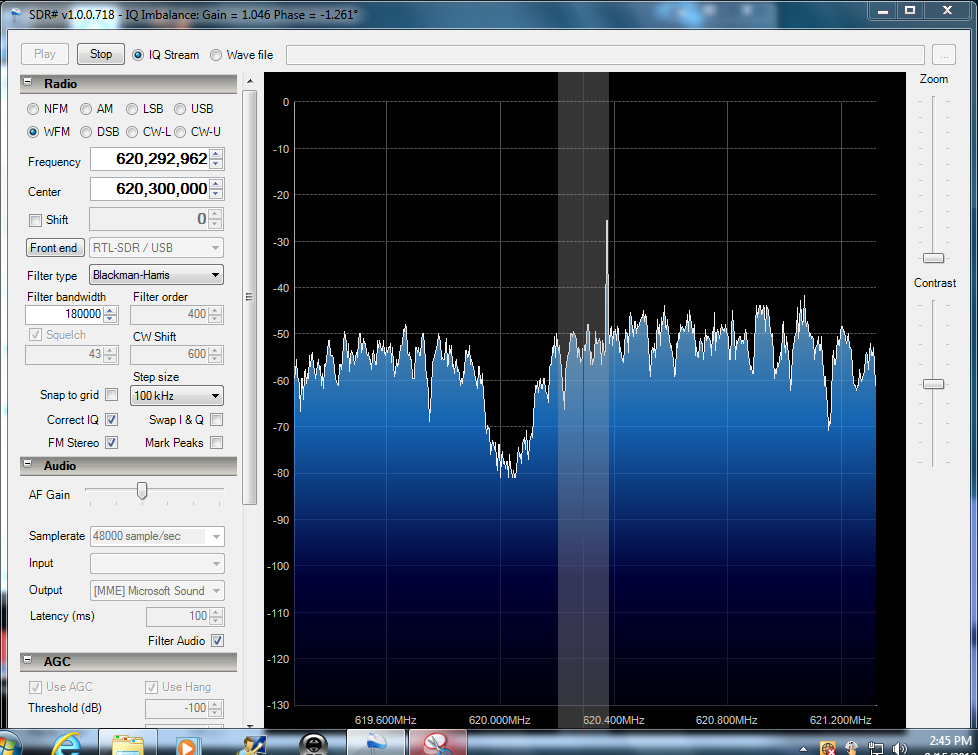 SDR# display showing KENS-DT-39 pilot (620.310 MHz) - 09-15-2012 1445 CST
(part of KVDA-DT-38 is on the left)
SDR# display showing KENS-DT-39 pilot (620.310 MHz) - 09-15-2012 1445 CST
(part of KVDA-DT-38 is on the left)
(the following png images have had text added to them with PSP4)
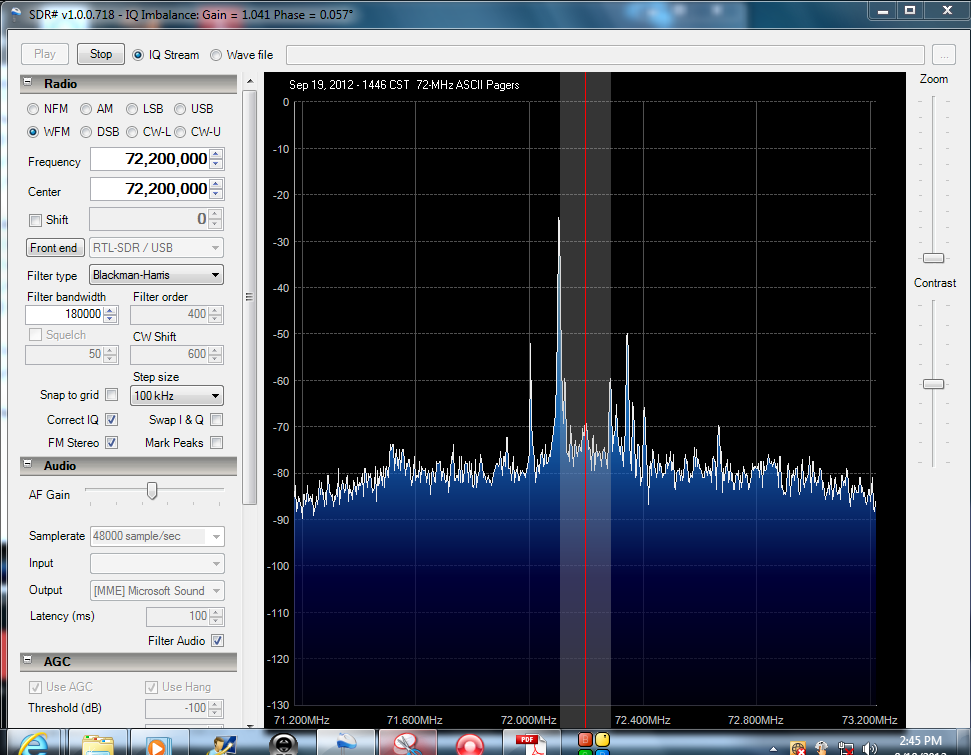 SDR# display showing ASCII pagers between Ch 4 and Ch 5 (72-MHz) - Sept 19, 2012
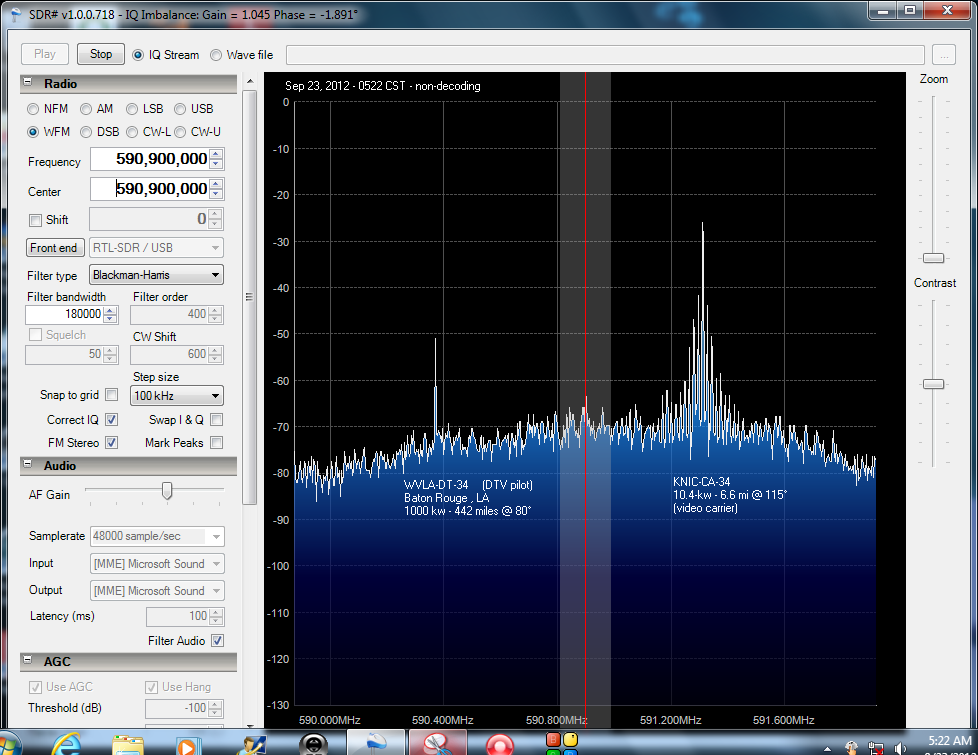 SDR# display showing WVLA-DT-34 pilot (non-decoding) and local KNIC-CA-34 NTSC video carrier - Sep 23, 2012
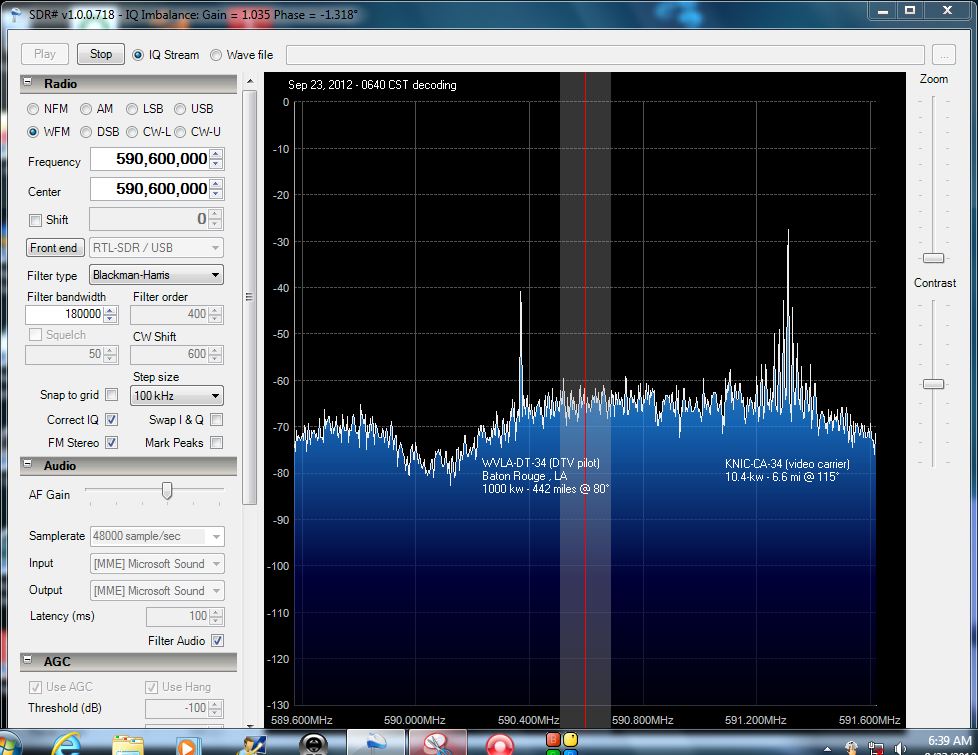 SDR# display showing WVLA-DT-34 pilot (decoding) and local KNIC-CA-34 NTSC video carrier - Sep 23, 2012
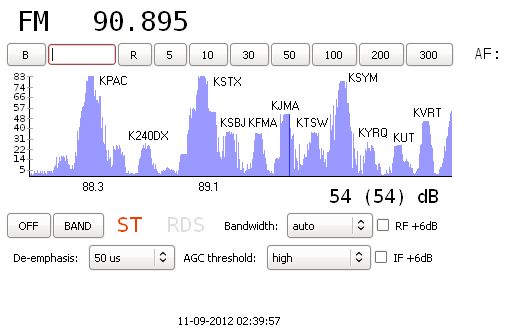
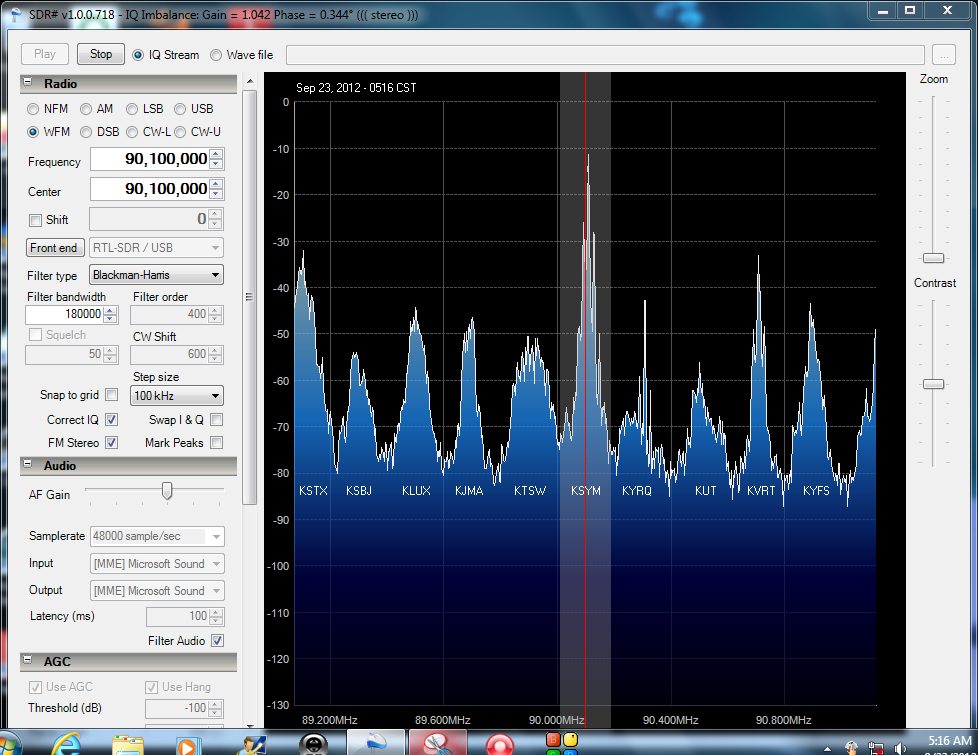 SDR# display 89.1-90.9 MHz - Sept 23, 2012
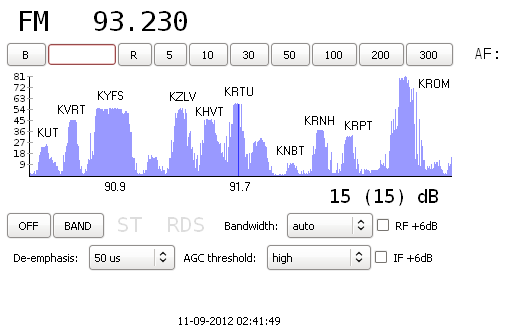
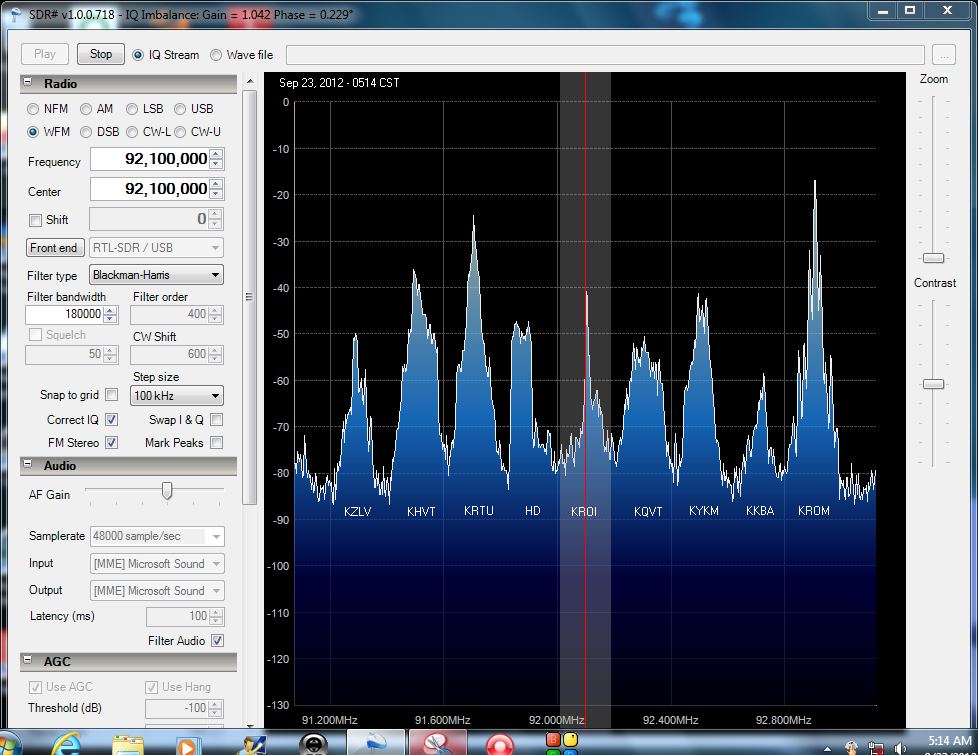 SDR# display 91.3-92.9 MHz - Sept 23, 2012
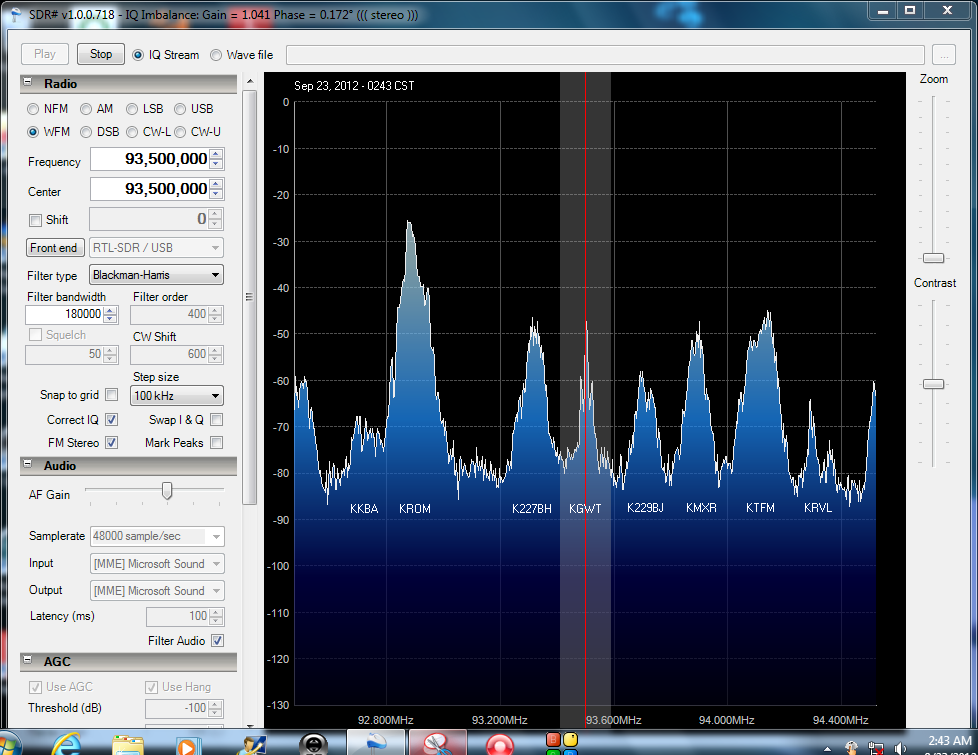 SDR# display 92.7-94.3 MHz - Sept 23, 2012
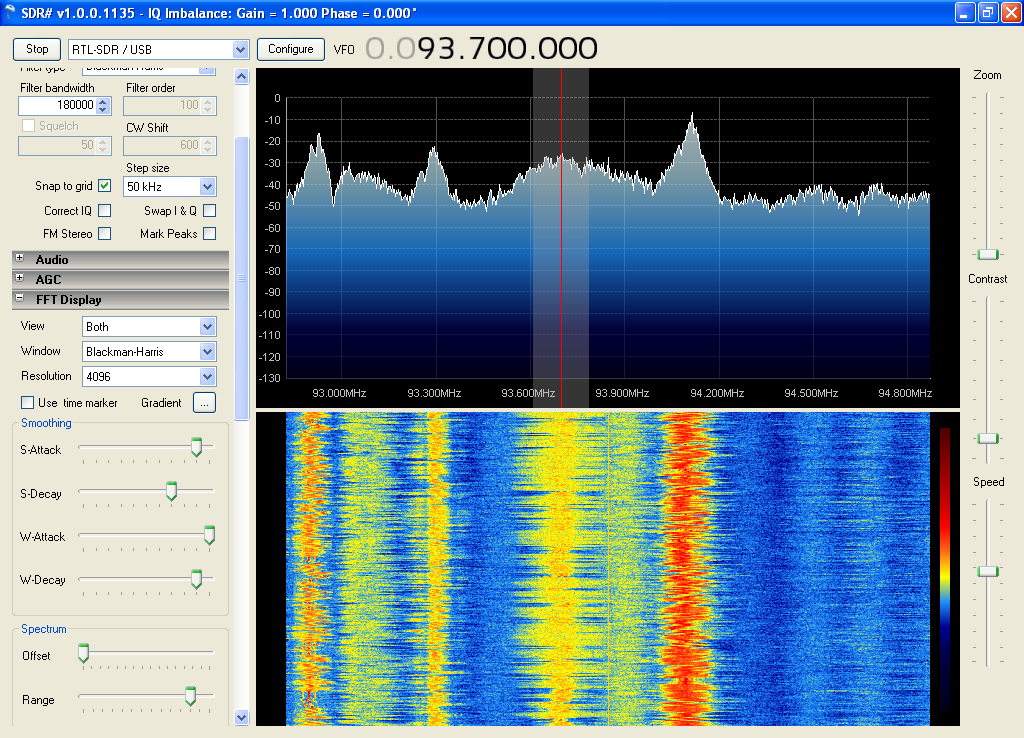
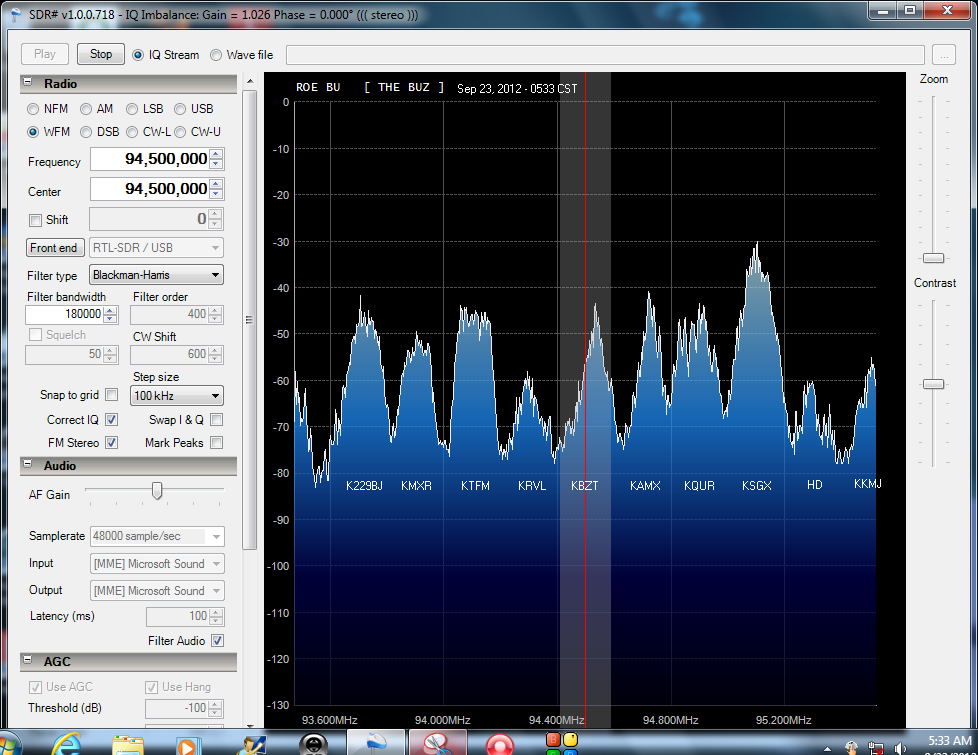 SDR# display 93.7-95.5 MHz - Sept 23, 2012
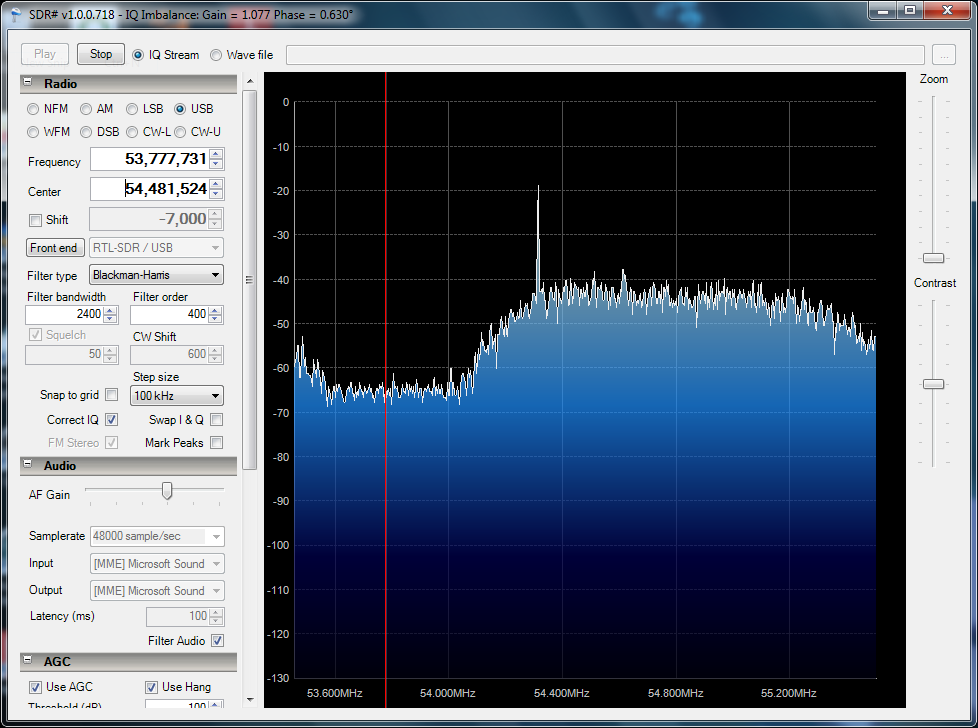 SDR# display of KOTA-DT-2 pilot (54.310 MHz) via Es - 05-14-2013 - 1126 CST
KOTA-DT-2 May 19, 2013 showing Es QSB & "rolling" MUF
SDR# display of KOTA-DT-2 pilot (54.310 MHz) via Es - 05-14-2013 - 1126 CST
KOTA-DT-2 May 19, 2013 showing Es QSB & "rolling" MUF
 SDR# display Jul 8, 2013 - badly overdeviating by local 93.7 LPFM
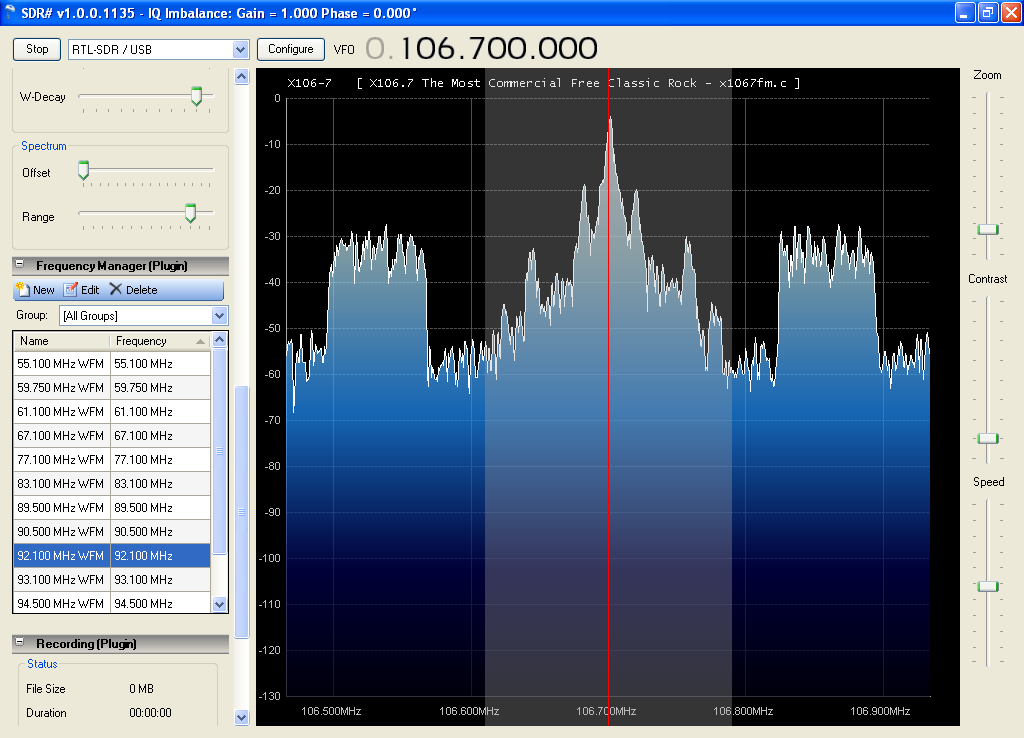 SDR# display Jul 9, 2013 - close-up of local 106.7 HD - note how sharp the sidebands fall off at 106.5 and 106.9