
|
|
Introduction
IN THE MODERN communications laboratory, exotic spectrum analysers are normally available to accurately plot the response of IF channels and those special crystal element filters used to shape the response of the channels. Such expensive test equipment is not often available to the average radio amateur, but if he becomes involved in assembling his own filters, or performance checking of receivers, some simpler form of test equipment might be sought. Because of this, the writer made an effort to design a simple sweep generator which could be used in conjunction with the radio shack cathode ray oscilloscope (CRO) to plot the response. The objective was to make a generator which could operate over a range of frequencies which included 455kHz and higher IF channels such as 9MHz and 10.5MHz. The task seemed simple enough if made to operate at one frequency, but a little more thought was required for the instrument to operate over a wide range of frequencies.
The finalised circuit makes use of a frequency modulated oscillator of fixed centre frequency which is heterodyned with an external variable RF signal source. This assumes that the user has some form of signal generator for general use in the radio shack.
Basic Sweep Generator
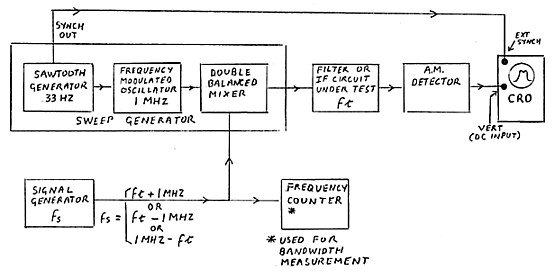
A basic system for the sweep generator is shown in figure 1. A low-frequency sawtooth wave is generated from some form of oscillator or waveform generator. The instantaneous voltage of the sawtooth wave controls the frequency of an RF oscillator with its centre frequency set at the centre frequency of the device under test (filter or IF channel etc). Over a single sweep of frequency, RF output voltage from the device, as a function of time, is a plot of the filter response. By rectifying and RF filtering in a simple AM detector, the output is converted to a DC voltage varying as a function of time and this voltage is applied to the vertical input of the CRO. By synchronising the sweep of the CRO with the sawtooth output, the device response is plotted on the CRO screen.

To achieve this for a range of frequencies, it is easiest to sweep a single frequency (say 1MHz) and heterodyne this to the test frequency required. The system developed is shown in the block diagram, figure 2. A 1MHz oscillator is frequency modulated by the output of a sawtooth generator operating at 33 Hz. The modulated output is beat with an external signal generator set to provide the difference frequency centered at the center frequency of the filter or IF circuit under test. The output of circuit under test is fed to a simple AM detector which provides varying DC output level to fed the CRO vertical input. By synchronising the CRO sweep circuit to the 33 Hz sweep generator, a plot of test circuit response is displayed in terms of amplitude verses frequency
The Heterodyne Sweep Generator
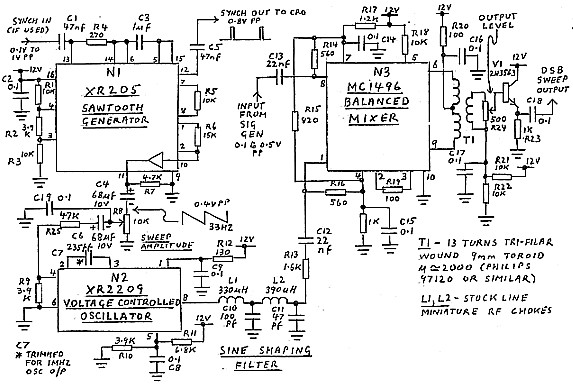
Circuit detail of the heterodyne sweep generator is shown in figure 3. Operation is described as follows:
The XR205 sawtooth generator NI drives a voltage-controlled oscillator N2 operating at a fixed centre frequency of 1MHz. This is a very stable IC package type XR2209 which can operate at 1MHz with its frequency set by external R and C components. Its output at pin 8 is a triangular waveform and this is shaped to a sine wave by LP filter Ll, C10, L2 and C11. The sweep frequency span is controlled by the amplitude of the sawtooth wave and this is set by potentiometer R8.
The 1MHz sweep output is mixed with an external variable signal source (such as a standard signal generator) in a double balanced mixer N3. This balances out the two input signals and delivers two frequencies which are the sum and difference of the input signal frequencies. The well-known MC1496 is used for this function and provides a high output level of mixed signals up to around 20MHz with output falling off as 25MHz is approached. Its low-frequency performance is limited to around 100kHz by the primary inductance of coupling transformer TI, wound on a small ferrite toroidal core. Output level is set by potentiometer R24 coupled via emitter follower stage V1 to provide low output impedance. For satisfactory operation, the signal level from the external signal source needs to be around 0.1 to 0.5 VPP.
To set up for a given output frequency, it is only necessary to set the external signal generator to a frequency 1MHz removed from the required frequency. No tuning is required in the sweep generator itself. Of course, there is always a second image frequency component at the output, but as the filter or IF channel being tested is itself a selective band limiting device, the image component is rejected from reaching the detector circuit.
From an operational point of view, the precise centre frequency of the fixed internal sweep oscillator is not important. However, by setting it right at 1MHz, the frequency required from the external oscillator becomes obvious without putting pencil to paper or referring to the calculator. The precise frequency of the oscillator can be set to 1MHz by trimming the value of C7. The XR2209 is a very stable oscillator provided its supply voltage is held constant. Hence, the 12V supply to the sweep generator must be regulated.
The MC1496 (N3) used was the TO5 package and the pin numbers shown are for that package. The pin numbers for the DIL package would be different. Packages N1 and N2 are both DIL types.
Detector
A simple AM detector is all that is required to convert the amplitude varying RF signal to a varying DC level for the CRO vertical input. The time constant of the RF filter must be sufficient to remove the RF ripple, but short enough for it to follow the amplitude variations. If the IF channel of an AM receiver were being measured, the AM detector in the receiver would do the job nicely without any further circuitry.
Figure 4 shows the detector circuit used by the writer. Germanium diodes D1 and D2, with low forward voltage loss were used in preference to silicon diodes to reduce the zero reference error. The 0A73 diodes shown were an early type used as detectors in TV receivers. The writer happened to have some of these but other germanium diodes suitable for high frequencies would also have done the job. The RF pre-amplifier V1-V2 was included to provide extra gain for measuring filters which had high insertion loss and delivered an output of inadequate level. A fairly high level into the diode detector is desirable to ensure that the zero reference error is minimal. The level must also be adequate to drive the CRO vertical deflection circuit. A gain control is provided as, on the other hand, too high a signal level input can drive the amplifier into saturation. If this happens, the plotted response curve can appear flatter at the top than it really is. If in doubt, a check can be made of the RF waveform across R6, using the CRO.

For the record, it is pointed out that the input resistance of V1 is not particularly high and if connected across high impedance circuits, it might require a further high resistance interface. Its actual input resistance depends on the setting of the gain control and is highest when the control is set for lowest gain.
The CRO
The detected output contains only AC components within the audio frequency range and hence almost any bandwidth oscilloscope is suitable provided that it has an external trigger facility. Coupling via the DC input is preferred so that a zero reference can be defined for the plotted curve. When AC coupling is used, the position of zero reference must vary with the amplitude and shape of the plotted curve. Hence, if only AC coupling is available on the oscilloscope, some interpretation is needed to establish the zero reference.
Another problem with AC coupling, which might be experienced in early types of oscilloscopes, is a restriction in low frequency response. With such a low sweep frequency used, this might cause distortion of the curve shape.
The External Signal Generator
Generally speaking, any signal generator with the required frequency range can do the job provided it is reasonably stable and free of FM noise. If there is a problem of stability, it will show up particularly at the high frequencies. If the signal source wanders in frequency, the trace will, in turn, wander across the CRO screen making it difficult to evaluate its shape and scale off its bandwidth. The writer's ageing Advance E1 signal generator (with valves) proved to be reasonably stable. At high frequencies (around 11MHz) a very slight jitter showed up in the trace. This was thought to be due to the carrier being frequency modulated by 50Hz. (Very close to the 33Hz sweep frequency).
On the other hand, the writer's Belco signal generator was unsatisfactory for the purpose at high frequencies. Using this source, it was difficult to hold the trace steady on the screen and it also introduced ripple on the top of the trace.
Had a suitable signal generator not been available, an alternative could have been to build in a stable variable frequency oscillator as part of the sweep generator unit.
Reading the Curves
In plotting the response of those filters which are made up of a number of crystal elements, some surprising bumps and kinks show up in the trace. In these filters, the measured response is often quite different from the nice smooth curves shown in the glossy brochures. The perturbations as read on our equipment are even more pronounced than on the usual spectrum analyser because the vertical axis is plotted in a linear form, whereas the spectrum analyser is plotted in decibels. A typical spectrum analyser screen might plot 10dB per graticule division and hence a 3dB trough in response would be about one third of a graticule division. In the linear plot, 3dB is represented as 70 per cent of the whole trace height.
Bandwidth is defined as the range of frequencies with an amplitude within 3dB down or 0.707 of the maximum amplitude. To measure bandwidth, a simple procedure has been adopted. First adjust the trace height to say 10 graticule units. Adjust the frequency of the external signal generator so that the left hand gradient of the curve intersects the centre graticule line at 70 per cent of the trace height or seven graticule units. (Refer figure 5a). Now accurately measure the frequency of the external signal generator with a frequency counter and record the value.
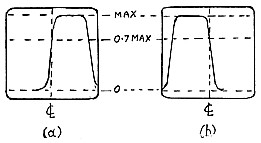
Readjust the frequency of the signal generator so that the right-hand gradient of the curve intersects the centre graticule line at 70 per cent of the trace height. (Refer figure 5b). Again measure and record the signal generator frequency using the counter. Bandwidth is calculated as the difference in frequency of the two measurements made.
Another method of measuring bandwidth is to scale off using the graticule scales. Before this method can be used, it is necessary to calibrate the sweep amplitude control (R8 in figure 6) in terms of sweep width in kHz. Once this has been done for all time, the control can be set to a reference width (say 10kHz). If the CRO graticule of 10 divisions wide, adjust the horizontal amplitude on the CRO sweep to exactly embrace 10 divisions. (Blips on the trace normally show up to mark where the sweep starts and finishes). Each graticule division is now lkHz wide and this can be used to scale the curve width at an amplitude 70 per cent of maximum.
Calibration of the sweep amplitude control requires some patience. To measure sweep width, choose a prominent bump or kink on a typical trace and adjust this by shifting the signal generator frequency until it coincides with the start of the trace. Measure and record the frequency using the counter. Now change the frequency of the signal generator so that the reference bump or kink coincides with the finish of the trace. Again measure and record the frequency. The difference frequency between the two readings is the sweep width. Some repetition of this procedure is needed to build up data to calibrate the control.
In the writer's unit, maximum sweep width possible was 47kHz and the sweep width control was calibrated from this figure down in steps to lkHz. In the heterodyne sweep generator, the frequency modulated oscillator has a fixed centre frequency and hence the sweep calibration holds good for whatever frequency is taken out of the mixed stage.
Another measurement which can be made on the filter under test is its out-of-band rejection figure. This can be done by scaling off voltage readings on the CRO graticule. The output signal from the detector is set to a suitable level and the voltage step (V1) above zero reference, in the centre of the passband, is recorded. Maintaining the same signal level, the voltage step (V2) above zero reference, out of the passband, is also recorded. To take the second reading, it becomes necessary to step around the CRO vertical multiplier switch to resolve the lower value. In each case, the zero reference is checked by earthing the input. (Most oscilloscopes have a switch for this purpose). The out-of-band rejection in dB is equal to 20 log (V1/V2). The writer was able to measure out-of-band rejection figures as high as 55dB using this procedure. Measurements beyond this could be expected to be limited by the noise level of the measuring system.
Assembly
As the heterodyne sweep generator electronics are essentially three IC packages with associated components and the detector is essentially a few transistor and diode stages, the physical size of the unit is mainly set by the three potentiometer controls and five input and output connectors. The connector points are required for synchronisation, signal generator input, sweep RF out, detector input and output to the CRO. To house the unit, the writer made use of one of the Dick Smith Electronics small aluminium boxes. As the unit was experimental, the general components were hard wired on a piece of blank circuit board. The board suffered quite a few changes over the period of development and hence its final form was not suitable to submit as an optimised layout. This is another task which someone else might take up perhaps on printed circuit board.
Evaluation
To cheek the performance of the sweep generator, it was used to plot the response of a number of filters, which had previously been evaluated using a good quality spectrum analyser. Both narrow band (3kHz) and wideband (15kHz) ceramic filters for 455kHz were checked out. The response of a 455kHz IF strip was also plotted. At the higher frequencies, quartz crystal ladder filters set at 9MHz and 11.5MHz were used. The heterodyne system operates up to 25MHz but no filters or IF strips were on hand to plot a curve above 11.5MHz. Operation between 11.5 and 25MHz is therefore assumed but not fully proven. Of course, at 25MHz, the external signal source would have to be very stable.
Summary
The finalised heterodyne sweep generator circuit makes use of three integrated circuit packages, one for sawtooth generation, one as a frequency modulated fixed carrier frequency oscillator and one to mix the modulated oscillator with an external variable signal source. The circuit as built can be used for response curve measurements in the frequency range of 100kHz to 25MHz. Sweep widths can be varied between zero and 47kHz. The circuit operates in conjunction with an external variable frequency signal generator and a cathode ray oscilloscope. For accurate bandwidth measurements, a frequency counter, or some other means of accurately measuring the signal generator frequency, is also needed. On the other hand, if the sweep width control is pre-calibrated, an estimate of bandwidth can be made using the CRO graticule scale.
The sweep generator unit, itself, is untuned, and the only tuning required is that of the external signal generator.
Assembly of crystal ladder filters for single sideband operation is often carried out by the home-constructing radio amateur. The sweep generator unit is very useful to check out the performance of these.