|
|
| The following data is a dynamic collection from
various webpages. These maps and charts are helpful to predict
low-band conditions as a function of northern magnetic disturbance.
Relying on the basic Boulder (WWV) K and A index is often misleading.
The data here more accurately reflects the geomagnetic conditions along
the great circle northern paths from VE6 to EU. Many complex and
subtle phenomena effect low-band DX propagation.
However, from northerly locations like VE6, band openings on
80 and 160m seem to be mostly dependant on geo-magnetic
activity levels. This page will automatically
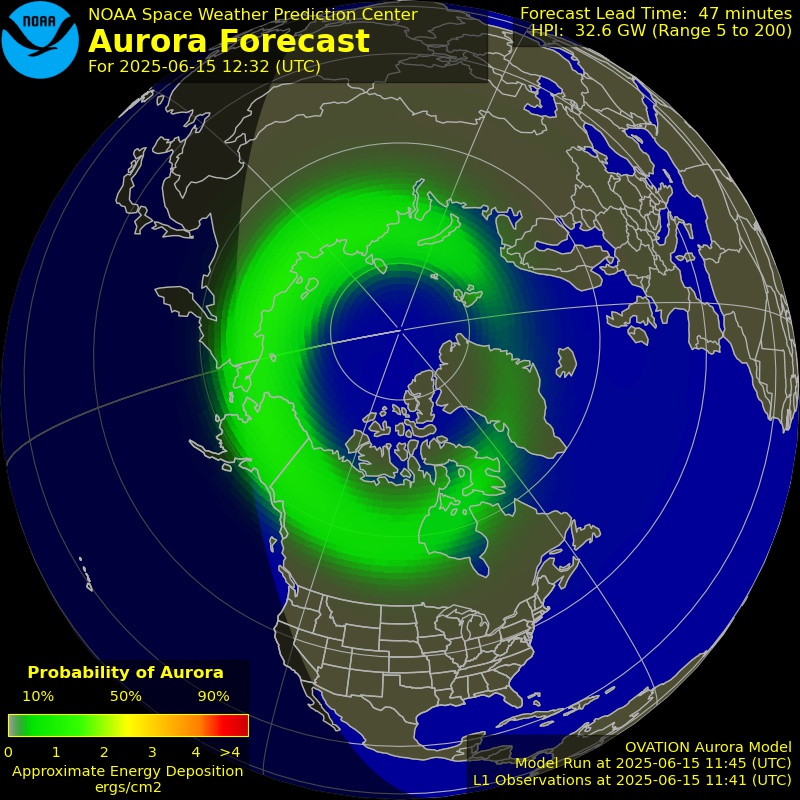
refresh and update with the latest numbers. (Photo at right: A satellite
view of Canada showing the aurora "ring of
fire"...what a shot !!)
MORE INFO FROM SPACE WEATHER CANADA |
 |
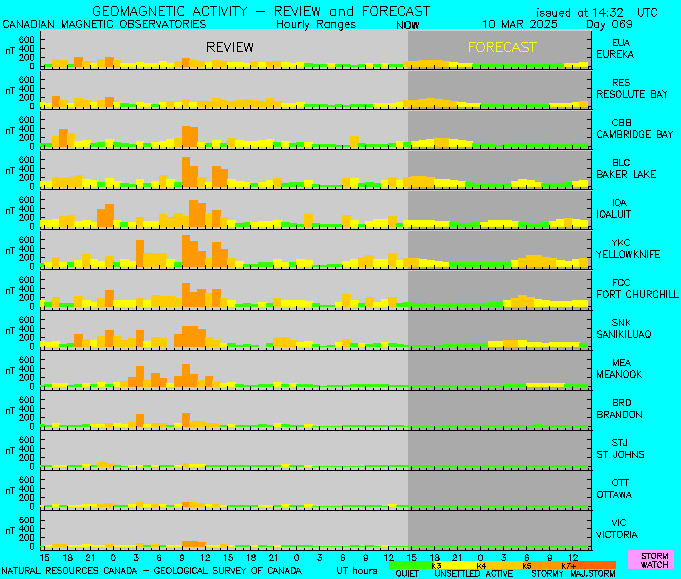
MAGNETIC OBSERVATORIES
LOCATIONS
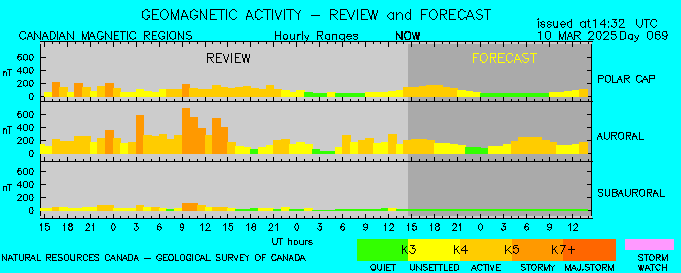
Graph - Multi-Station Review and Forecast
|
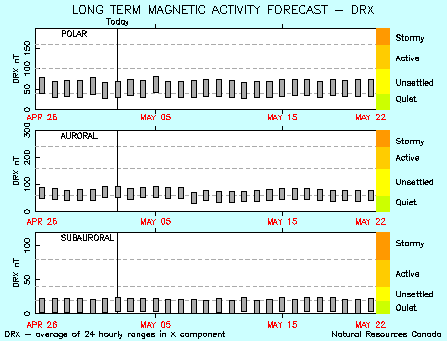
Graph-3 Zone Review and Forecast
27 DAY MAGNETIC FORECAST
DRX for the zone is the mean of 24, 1
hour values. Because this averaging process has the effect of
smoothing (filtering) the more rapid fluctuations in the field, the
qualitative descriptors are defined rather differently than for the
short-term forecasts. Units are nanoteslas (nT). This could be
roughly equivalent to a one-day "A-index"
|
CURRENT NORTH AURORAL OVAL ACTIVITY
 |
CURRENT SOUTH AURORAL OVAL ACTIVITY
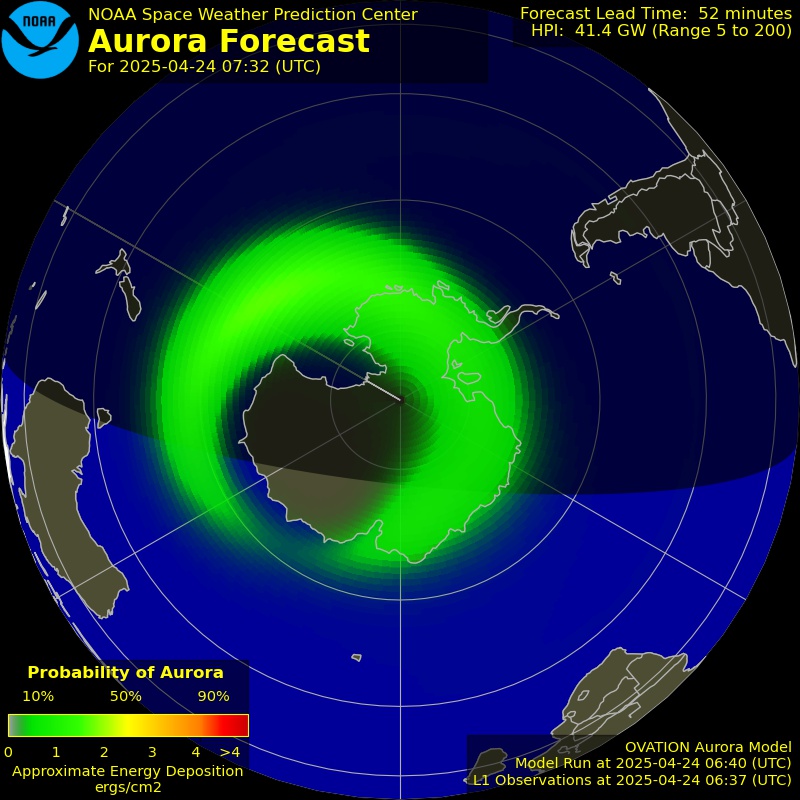 |
Explanation - Real Time Status Reports and Forecasts of
Regional Geomagnetic Conditions
Real Time Status Reports
The Reports for the several geographic regions are derived from actual
measurements made at magnetic observatories situated in each of the regions. In
each case, data are telemetered from the observatory to headquarters in Ottawa,
where the data are processed to produce a Kr index to characterize the level of
magnetic disturbance measured during the past hour.
For the Eastern North America region, the status report is updated every
minute, whereas reports for the other regions are updated every five minutes,
because of less frequent data telemetry.
For qualitative comparison, the words describing the activity levels used in
other forecast formats in this web site are included. Colours in the display
panels change according to the level of the magnetic activity and Kr index,
ranging from green, through yellow, amber, orange, to red.
Regional Forecasts
The Forecasts are provided as summaries of the expected activity during the
next 3 hours and during the following 3 hours, for each of the regions. Again,
for ease of comparison with other sources of information, they are presented in
terms of the Kr index. The forecasts are updated every fifteen minutes. The
words describing the activity levels and the panel colour scheme used for the
Status Reports also apply to the Forecast panels. When appropriate, Major Storm
Watches are issued, indicating that conditions are such that Major Storm
activity could occur during the time interval. When a watch is in effect, the
upper part of the appropriate panel is coloured purple, and a Storm Watch
message appears below the Forecast panels.
Kr Index
The Kr index is approximately equivalent to the local K index, but whereas
the true K index is not routinely available until the day after data are
measured (and then only for three observatories), the Kr index is available
almost immediately. The two indices can differ slightly at low levels of
activity but are not significantly different at high levels of activity. There
are nine levels in the Kr index, as in the K index. Whereas the K index is
defined over an interval of 3 hours, the Kr index is defined over an interval of
1 hour. It is derived from the running hourly range computed from the incoming
observatory data, and is equivalenced to the K scale.
DRX (24hr Kr mean) "A-index"
The levels of geomagnetic field activity, or disturbance,
currently used in the long-term (up to 27 days) forecasts are labelled
qualitatively for general usage. For each of the three major zones (subauroral,
auroral, polar cap), the range of activity is divided into four classifications:
quiet, unsettled, active, storm. The actual parameter used for reporting and
forecasting magnetic activity is a daily index. It is known as DRX and is the
average of the hourly ranges (maximum minus minimum during each hour) in the X
(northward) component of the magnetic field intensity for a day (the UT [or GMT]
day), ie DRX for the zone is the mean of 24 values. Because this averaging
process has the effect of smoothing (filtering) the more rapid fluctuations in
the field, the qualitative descriptors are defined rather differently than for
the short-term forecasts. Units are nanoteslas (nT).
| Below are soft X-ray solar images. Bright spots indicate
active regions or flares. Click the image to see real-time .gif movies of
the sun. (from SOHO: http://soho.nascom.nasa.gov/
) |
| SOHO-17.1mm |
SOHO-19.5mm |
SOHO-28.4mm |
SOHO-30.4mm |
 |
 |
 |
 |
Below is the latest solar image from SDO (solar dynamics observatory) at an
AIA wavelength of 171 (Go here for more images and detail:
http://sdo.gsfc.nasa.gov/data/)
Click the image for a larger view...amazing detail!
| Below is an EXCEL chart showing how the DAILY A index changes
relative to sunspot numbers from 1932 till present. Created from raw
data downloaded from: GFZ Potsdam Black is Sunspot number,
Orange is Ap
Notice how the geomagnetic activity seems to be lowest (low Ap)
just at the beginning of the up-cycle of each sunspot cycle.
|


Below is a great interactive resource from NOAA plotting
the sunspots since 1750! You can select any time frame you want to
zoom in....Click the photo to go to the page....
 |
BACK TO VE6WZ